Bethel: Fire Incidents, Connecticut (CT)
Where are fire incidents reported in Bethel, CT
Something went wrong! Please refresh the page.
| Fire incidents reported | |
|---|---|
| Sreet name | Count |
| STONY HILL RD | 124 |
| GREENWOOD AV | 108 |
| GRASSY PLAIN ST | 80 |
| PUTNAM PARK RD | 78 |
| WOOSTER ST | 68 |
| OLD HAWLEYVILLE RD | 58 |
| WHITTLESEY DR | 58 |
| WALNUT HILL RD | 50 |
| PLUMTREES RD | 44 |
| CODFISH HILL RD | 36 |
| TAYLOR AV | 32 |
| DODGINGTOWN RD | 30 |
| CHESTNUT RIDGE RD | 28 |
| NASHVILLE RD | 28 |
| TURKEY PLAIN RD | 26 |
| MAPLE AV | 22 |
| RESERVOIR ST | 22 |
| ROCKWELL RD | 22 |
| SOUTH ST | 22 |
| FRANCIS CLARKE CIR | 20 |
| PAYNE RD | 20 |
| BETHPAGE DR | 18 |
| CHESTNUT ST | 18 |
| DRUMMERS LA | 18 |
| PARK LAWN DR | 18 |
| REDWOOD DR | 18 |
| TAYLOR RD | 18 |
| WINDAWAY RD | 18 |
| DIAMOND AV | 16 |
| NATURE VIEW TR | 16 |
2002 - 2018 National Fire Incident Reporting System (NFIRS) incidents
- Incident types reported to NFIRS in Bethel, CT
- 1,51325.0%Hazardous Condition
- 1,11018.3%Fire
- 1,10818.3%False Alarm
- 1,01916.8%Good Intent Call
- 66611.0%Rescue & EMS
- 6019.9%Service Call
- 200.3%Overpressure Rupture
- 150.2%Severe Weather
- Fire incident types reported to NFIRS in Bethel, CT
- 61555.4%Structure Fires
- 27224.5%Outside Fires
- 11510.4%Mobile Property/Vehicle Fires
- 1089.7%Other
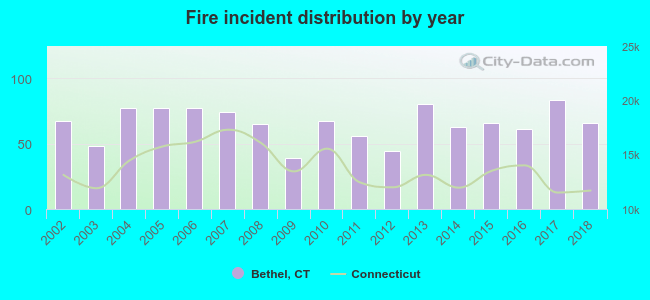 Based on the data from the years 2002 - 2018 the average number of fire incidents per year is 65. The highest number of reported fire incidents - 83 took place in 2017, and the least - 39 in 2009. The data has a decreasing trend.
The average number of yearly fire incidents per 10k residents in Bethel, CT compared to nearest cities:
(Note: Based on data for the last 3 years, including only cities with population 5,000 and above)
| Bethel: | 73.3 |
| Danbury: | 19.2 |
| Redding: | 19.3 |
| Brookfield: | 22.3 |
| Ridgefield: | 34.0 |
| New Fairfield: | 15.6 |
| Monroe: | 45.5 |
| Easton: | 34.3 |
| Weston: | 20.6 |
 The median response time based on all reported fire incidents is 6 minutes. This is similar to the Connecticut median value.
The median response time in Bethel, CT compared to nearest cities:
(Note: Based on data for all years, including only cities with at least 500 fire incidents)
| Bethel: | 6 minutes |
| Danbury: | 5 minutes |
| Redding: | 7 minutes |
| Newtown: | 7 minutes |
| Brookfield: | 6 minutes |
| Ridgefield: | 6 minutes |
| New Fairfield: | 7 minutes |
| Monroe: | 6 minutes |
| Weston: | 6 minutes |
 Based on the data from the years 2002 - 2018 the average number of fire-related casualties per year is 1. The highest number of injuries - 4 took place in 2013, and the lowest - 0 in 2002. The data has a growing trend.
The average number of casualties per 1,000 fires is 10. This indicator was the highest - 50 in 2013, and the lowest 0 in 2002. The trend for casualties per 1,000 fires is increasing. Compared to the Connecticut value the number of casualties per 1,000 incidents is similar.
Based on the data from the years 2002 - 2018 the average number of fire-related casualties per year is 1. The highest number of injuries - 4 took place in 2013, and the lowest - 0 in 2002. The data has a growing trend.
The average number of casualties per 1,000 fires is 10. This indicator was the highest - 50 in 2013, and the lowest 0 in 2002. The trend for casualties per 1,000 fires is increasing. Compared to the Connecticut value the number of casualties per 1,000 incidents is similar.Casualties per 1,000 incidents in Bethel, CT compared to nearest cities:
(Note: Based on data for all years, including only cities with at least 500 fire incidents)
| Bethel: | 10.8 |
| Danbury: | 20.3 |
| Redding: | 9.8 |
| Newtown: | 11.1 |
| Brookfield: | 5.9 |
| Ridgefield: | 6.7 |
| New Fairfield: | 14.3 |
| Monroe: | 3.6 |
| Weston: | 1.8 |
 28.5% incidents where reported in the morning and 71.5% in the evening. The most fires (17.2%) took place on Sunday, and the least (11.7%) on Tuesday.
 According to the 1,110 fires from years 2002 - 2018 most fires (10.4%) took place during March, and the least (4.7%) in September.
 Out of all 6,056 cases reported during the years 2002 - 2018, the most belonged to the categories: Hazardous Condition (25.0%), Fire (18.3%), and False Alarm (18.3%).
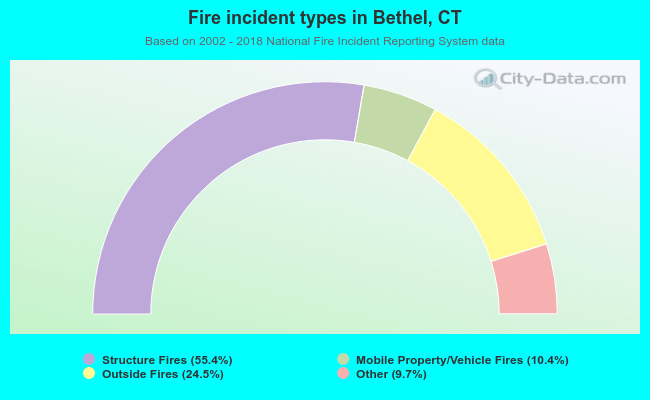 When looking into fire subcategories, the most reports belonged to: Structure Fires (55.4%), and Outside Fires (24.5%).