Binghamton: Fire Incidents, New York (NY)
Where are fire incidents reported in Binghamton, NY
Something went wrong! Please refresh the page.
| Fire incidents reported | |
|---|---|
| Sreet name | Count |
| FRONT ST | 224 |
| CASTLE CREEK RD | 124 |
| MAIN ST | 112 |
| CHENANGO ST | 110 |
| GLENWOOD RD | 110 |
| CHENANGO ST | 106 |
| ROUTE 81N | 100 |
| UPPER FRONT ST | 100 |
| ROUTE 81S | 96 |
| AIRPORT RD | 86 |
| RIVER RD | 74 |
| COURT ST | 68 |
| MAIN ST | 68 |
| BEVIER ST | 64 |
| HAWLEY ST | 64 |
| COLESVILLE RD | 44 |
| ROBINSON ST | 44 |
| STATE ST | 44 |
| FRONT ST | 42 |
| COURT ST | 40 |
| OAK ST | 40 |
| OLD STATE RD | 40 |
| KATTELVILLE RD | 38 |
| LEWIS RD | 38 |
| ROUTE 12 | 38 |
| VESTAL AV | 38 |
| MURRAY ST | 36 |
| CONKLIN AVE | 34 |
| HENRY ST | 34 |
| STATE ST | 34 |
| Other | 1,684 |
2002 - 2018 National Fire Incident Reporting System (NFIRS) incidents
- Incident types reported to NFIRS in Binghamton, NY
- 33,32162.9%Rescue & EMS
- 6,66812.6%Hazardous Condition
- 4,3418.2%False Alarm
- 3,7747.1%Fire
- 2,2594.3%Good Intent Call
- 1,9293.6%Service Call
- 5551.0%Overpressure Rupture
- 800.2%Special Incident
- 770.1%Severe Weather
- Fire incident types reported to NFIRS in Binghamton, NY
- 1,85549.2%Structure Fires
- 1,03227.3%Outside Fires
- 58915.6%Mobile Property/Vehicle Fires
- 2987.9%Other
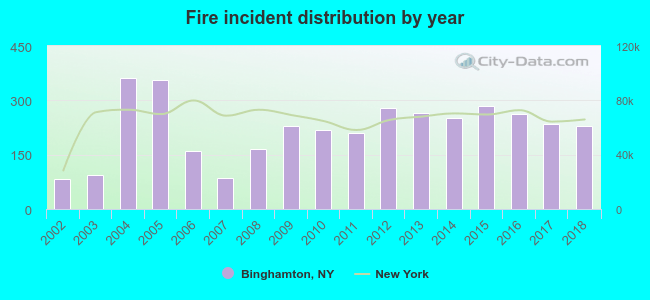 According to the data from the years 2002 - 2018 the average number of fires per year is 222. The highest number of reported fire incidents - 362 took place in 2004, and the least - 83 in 2002. The data has a rising trend.
The average number of yearly fire incidents per 10k residents in Binghamton, NY compared to nearest cities:
(Note: Based on data for the last 3 years, including only cities with population 5,000 and above)
| Binghamton: | 52.5 |
| Dickinson: | 5.7 |
| Johnson City: | 42.9 |
| Kirkwood: | 20.5 |
| Conklin: | 35.5 |
| Union: | 1.5 |
| Endwell: | 21.3 |
| Vestal: | 21.3 |
| Fenton: | 1.5 |
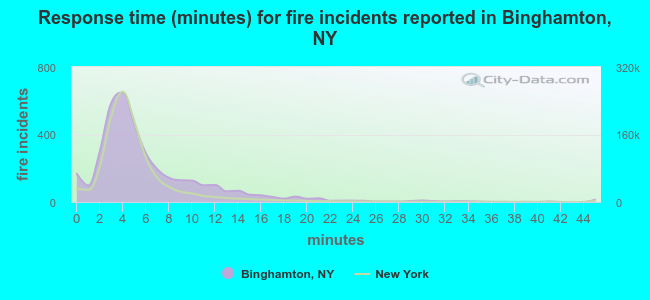 The median response time based on all reported fire incidents is 5 minutes. This is higher than the New York median value.
The median response time in Binghamton, NY compared to nearest cities:
(Note: Based on data for all years, including only cities with at least 500 fire incidents)
| Binghamton: | 5 minutes |
| Johnson City: | 4 minutes |
| Endwell: | 6 minutes |
| Vestal: | 8 minutes |
| Endicott: | 6 minutes |
| Owego: | 8 minutes |
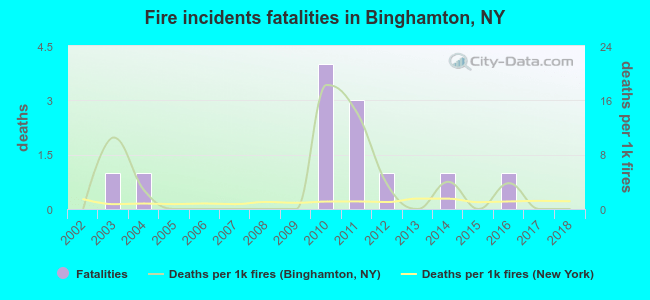 According to the reports from the years 2002 - 2018 the average number of fire-related yearly deaths is 1. The highest number of deaths - 4 took place in 2010, and the lowest - 0 in 2002. The data has a constant trend.
The average number of deaths per 1,000 fires is 3. This indicator was the highest - 18 in 2010, and the lowest 0 in 2002. The trend for deaths per 1,000 incidents is constant. Compared to the state value the number of fatalities per 1,000 fires is much higher.
According to the reports from the years 2002 - 2018 the average number of fire-related yearly deaths is 1. The highest number of deaths - 4 took place in 2010, and the lowest - 0 in 2002. The data has a constant trend.
The average number of deaths per 1,000 fires is 3. This indicator was the highest - 18 in 2010, and the lowest 0 in 2002. The trend for deaths per 1,000 incidents is constant. Compared to the state value the number of fatalities per 1,000 fires is much higher.Deaths per 1,000 incidents in Binghamton, NY compared to nearest cities:
(Note: Based on data for all years, including only cities with at least 2,500 fire incidents)
| Binghamton: | 3.2 |
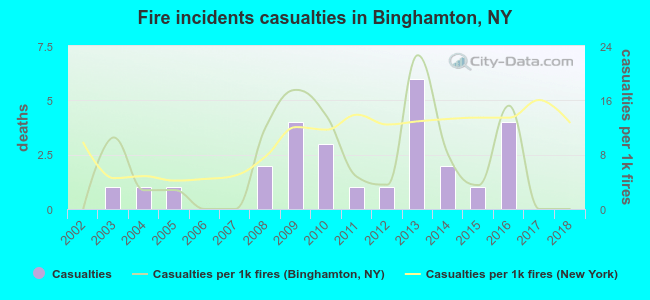 According to the data from the years 2002 - 2018 the average number of fire-related yearly casualties is 2. The highest number of reported injuries - 6 took place in 2013, and the lowest - 0 in 2002. The data has a constant trend.
The average number of casualties per 1,000 fires is 7. This indicator was the highest - 23 in 2013, and the lowest 0 in 2002. The trend for casualties per 1,000 fire incidents is constant. Compared to the state value the number of casualties per 1,000 fire incidents is lower.
According to the data from the years 2002 - 2018 the average number of fire-related yearly casualties is 2. The highest number of reported injuries - 6 took place in 2013, and the lowest - 0 in 2002. The data has a constant trend.
The average number of casualties per 1,000 fires is 7. This indicator was the highest - 23 in 2013, and the lowest 0 in 2002. The trend for casualties per 1,000 fire incidents is constant. Compared to the state value the number of casualties per 1,000 fire incidents is lower.Casualties per 1,000 incidents in Binghamton, NY compared to nearest cities:
(Note: Based on data for all years, including only cities with at least 500 fire incidents)
| Binghamton: | 7.2 |
| Johnson City: | 2.9 |
| Endwell: | 10.0 |
| Vestal: | 3.8 |
| Endicott: | 12.4 |
| Owego: | 0.0 |
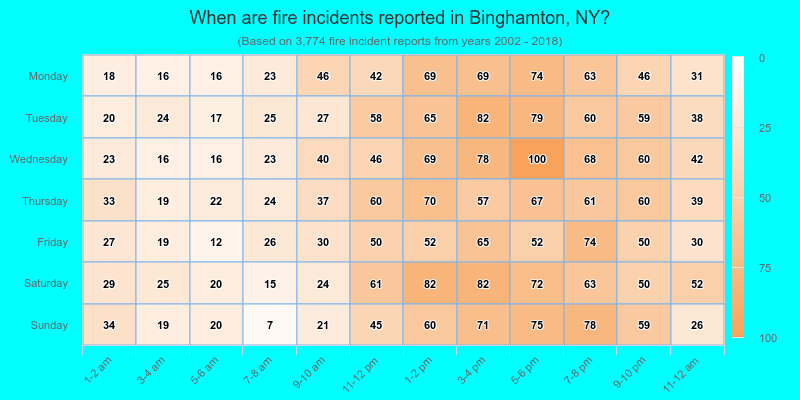
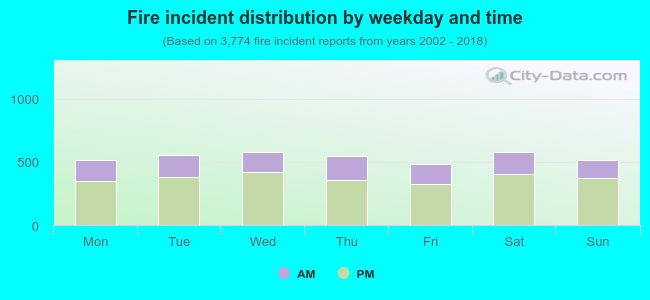 31.1% incidents where reported in the morning and 68.9% in the evening. The most fires (15.4%) took place on Wednesday, and the least (12.9%) on Friday.
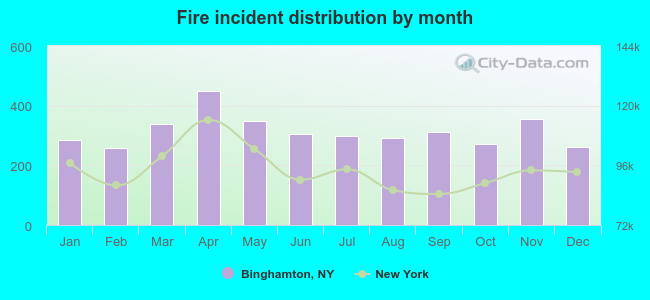 Based on the 3,774 fire incident reports from years 2002 - 2018 most fires (11.9%) took place during April, and the least (6.8%) in February.
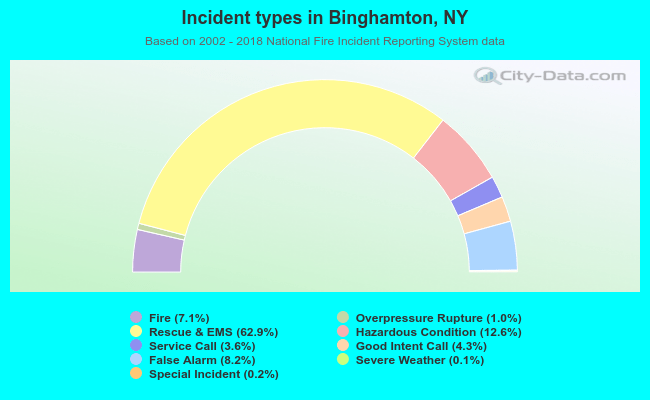 Out of all 53,004 cases reported during the years 2002 - 2018, the most belonged to the categories: Rescue & EMS (62.9%), Hazardous Condition (12.6%), and False Alarm (8.2%).
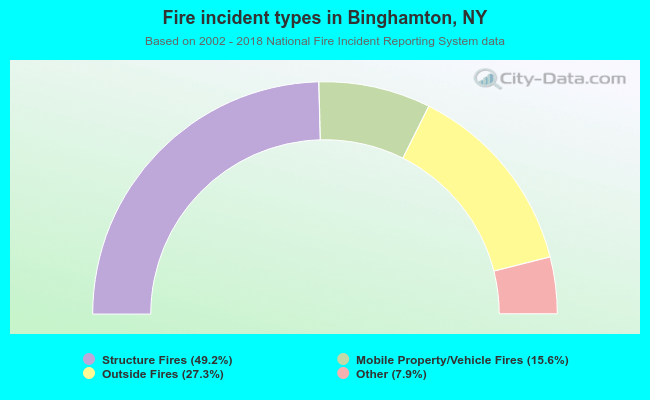 When looking into fire subcategories, the most reports belonged to: Structure Fires (49.2%), and Outside Fires (27.3%).