Johnson City: Fire Incidents, New York (NY)
Where are fire incidents reported in Johnson City, NY
Something went wrong! Please refresh the page.
|
| |||||||||||||||||||||||||||||||||||||||||||||||||||||||||||||||||||||||||||||||||||||||||||||||||||||||||||||
2002 - 2018 National Fire Incident Reporting System (NFIRS) incidents
- Incident types reported to NFIRS in Johnson City, NY
- 4,93747.7%Rescue & EMS
- 1,89818.3%Good Intent Call
- 1,35313.1%Hazardous Condition
- 7297.0%Service Call
- 7217.0%False Alarm
- 6796.6%Fire
- 270.3%Severe Weather
- Fire incident types reported to NFIRS in Johnson City, NY
- 32848.3%Structure Fires
- 21331.4%Outside Fires
- 9113.4%Mobile Property/Vehicle Fires
- 476.9%Other
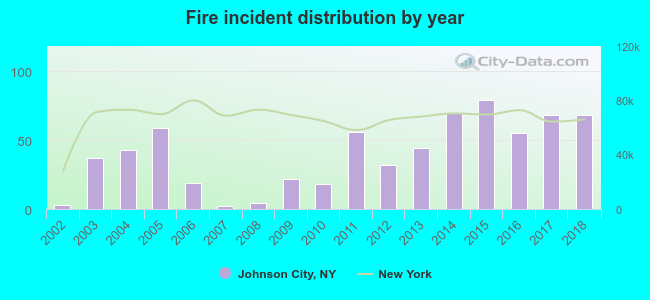 According to the data from the years 2002 - 2018 the average number of fire incidents per year is 40. The highest number of reported fires - 79 took place in 2015, and the least - 2 in 2007. The data has a rising trend.
The average number of yearly fire incidents per 10k residents in Johnson City, NY compared to nearest cities:
(Note: Based on data for the last 3 years, including only cities with population 5,000 and above)
| Johnson City: | 42.9 |
| Dickinson: | 5.7 |
| Binghamton: | 52.5 |
| Union: | 1.5 |
| Endwell: | 21.3 |
| Vestal: | 21.3 |
| Endicott: | 71.6 |
| Maine: | 9.9 |
| Kirkwood: | 20.5 |
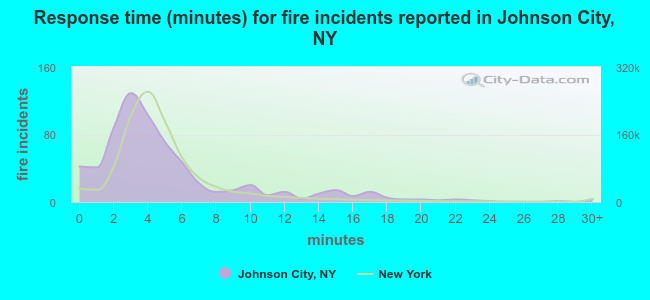 The median response time based on all reported fire incidents is 4 minutes. This is about the same as the New York median value.
The median response time in Johnson City, NY compared to nearest cities:
(Note: Based on data for all years, including only cities with at least 500 fire incidents)
| Johnson City: | 4 minutes |
| Binghamton: | 5 minutes |
| Endwell: | 6 minutes |
| Vestal: | 8 minutes |
| Endicott: | 6 minutes |
| Owego: | 8 minutes |
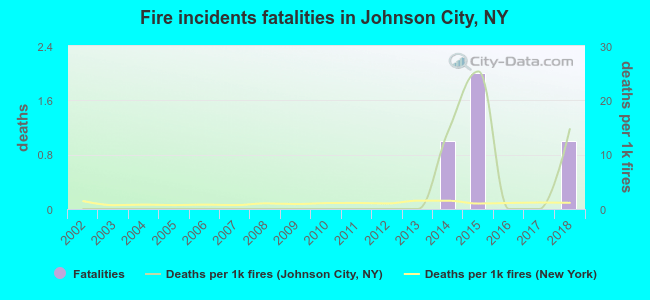 Based on the reports from the years 2002 - 2018 the average number of fire-related yearly deaths is 0. The highest number of deaths - 2 took place in 2015, and the lowest - 0 in 2002. The data has a rising trend.
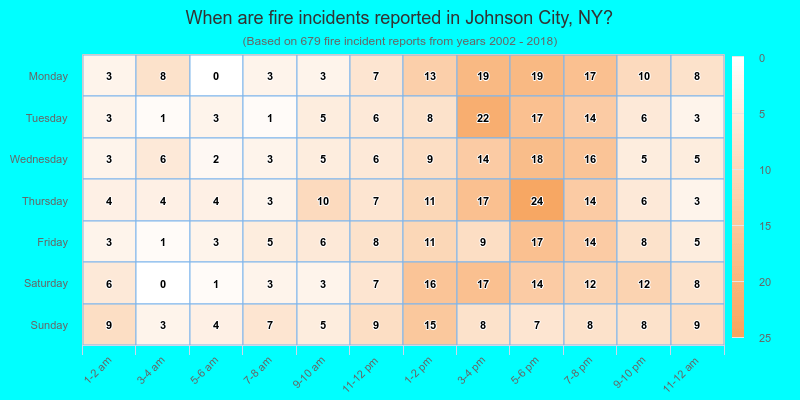
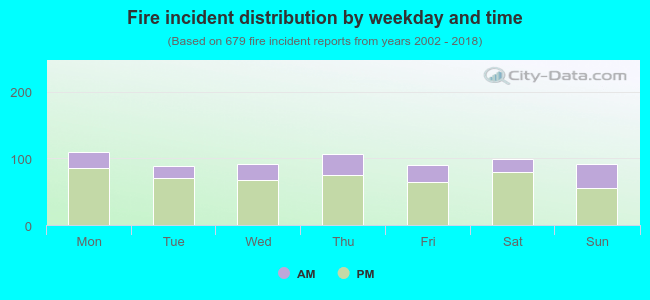 27.0% incidents where reported in the morning and 73.0% in the evening. The most fires (16.2%) took place on Monday, and the least (13.1%) on Tuesday.
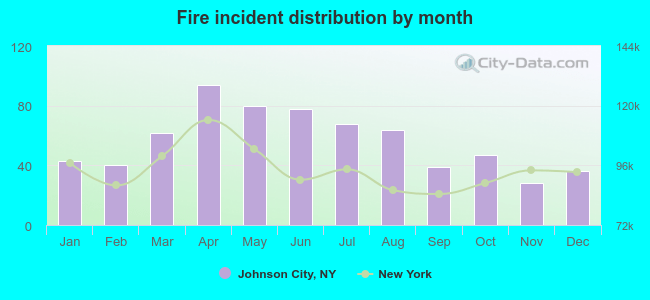 According to the 679 incident reports from years 2002 - 2018 most fires (13.8%) took place during April, and the least (4.1%) in November.
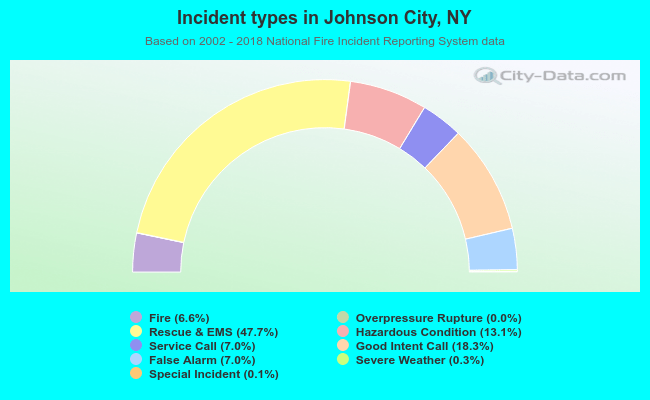 Out of all 10,355 cases reported during the years 2002 - 2018, the most belonged to the categories: Rescue & EMS (47.7%), Good Intent Call (18.3%), and Hazardous Condition (13.1%).
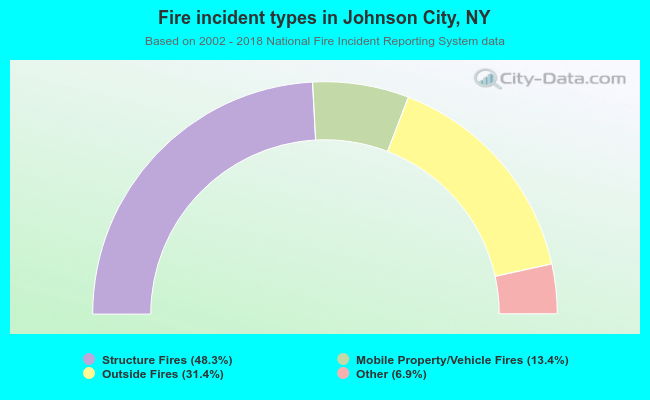 When looking into fire subcategories, the most incidents belonged to: Structure Fires (48.3%), and Outside Fires (31.4%).