Kirkwood: Fire Incidents, New York (NY)
Where are fire incidents reported in Kirkwood, NY
Something went wrong! Please refresh the page.
|
| |||||||||||||||||||||||||||||||||||||||||||||||||||||||||||||||||||||||||||||||||||||||||||||||||||||||||||||
2002 - 2018 National Fire Incident Reporting System (NFIRS) incidents
- Incident types reported to NFIRS in Kirkwood, NY
- 28620.7%Fire
- 25418.4%Rescue & EMS
- 24617.8%Hazardous Condition
- 24617.8%Service Call
- 21115.3%Good Intent Call
- 1198.6%False Alarm
- 181.3%Severe Weather
- 20.1%Overpressure Rupture
- Fire incident types reported to NFIRS in Kirkwood, NY
- 14149.3%Structure Fires
- 7225.2%Mobile Property/Vehicle Fires
- 6322.0%Outside Fires
- 103.5%Other
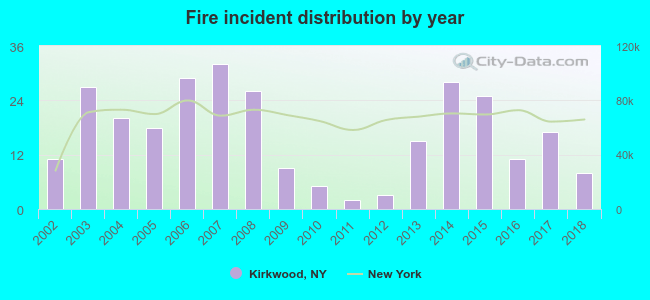 Based on the data from the years 2002 - 2018 the average number of fire incidents per year is 17. The highest number of fire incidents - 32 took place in 2007, and the least - 2 in 2011. The data has a declining trend.
The average number of yearly fire incidents per 10k residents in Kirkwood, NY compared to nearest cities:
(Note: Based on data for the last 3 years, including only cities with population 5,000 and above)
| Kirkwood: | 20.5 |
| Conklin: | 35.5 |
| Binghamton: | 52.5 |
| Dickinson: | 5.7 |
| Fenton: | 1.5 |
| Johnson City: | 42.9 |
| Colesville: | 3.8 |
| Union: | 1.5 |
| Vestal: | 21.3 |

 According to the reports from the years 2002 - 2018 the average number of fire-related yearly casualties is 0. The highest number of injuries - 1 took place in 2013, and the lowest - 0 in 2002. The data has a constant trend.
 22.7% incidents where reported in the morning and 77.3% in the evening. The most fires (18.2%) took place on Tuesday, and the least (11.9%) on Monday.
 Based on the 286 incident reports from years 2002 - 2018 most fires (11.9%) took place during April, and the least (4.9%) in December.
 Out of all 1,383 cases reported during the years 2002 - 2018, the most belonged to the categories: Fire (20.7%), Rescue & EMS (18.4%), and Hazardous Condition (17.8%).
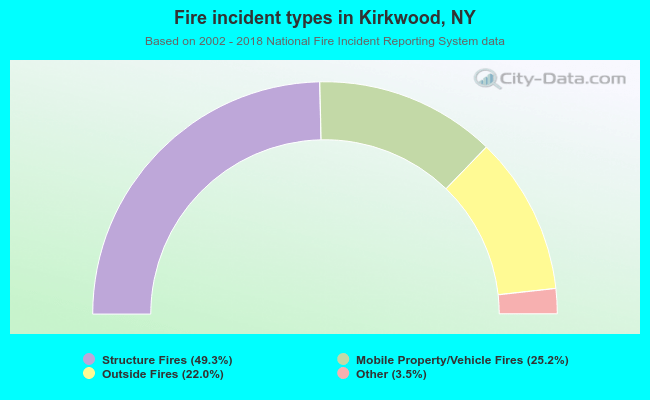 When looking into fire subcategories, the most incidents belonged to: Structure Fires (49.3%), and Mobile Property/Vehicle Fires (25.2%).