Birdsboro: Fire Incidents, Pennsylvania (PA)
Where are fire incidents reported in Birdsboro, PA
Something went wrong! Please refresh the page.
|
| |||||||||||||||||||||||||||||||||||||||||||||||||||||||||||||||||||||||||||||||||||||||||||||||||||||||||||||
| Other | 36 | |||||||||||||||||||||||||||||||||||||||||||||||||||||||||||||||||||||||||||||||||||||||||||||||||||||||||||||
2003 - 2018 National Fire Incident Reporting System (NFIRS) incidents
- Incident types reported to NFIRS in Birdsboro, PA
- 67331.3%Rescue & EMS
- 52024.2%Fire
- 29413.7%Good Intent Call
- 27012.6%Hazardous Condition
- 1748.1%Service Call
- 1617.5%False Alarm
- 401.9%Severe Weather
- 150.7%Special Incident
- Fire incident types reported to NFIRS in Birdsboro, PA
- 31560.6%Structure Fires
- 13826.5%Outside Fires
- 407.7%Mobile Property/Vehicle Fires
- 275.2%Other
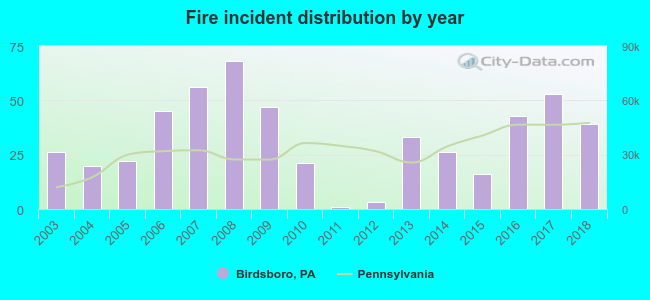 According to the data from the years 2003 - 2018 the average number of fires per year is 32. The highest number of reported fire incidents - 68 took place in 2008, and the least - 1 in 2011. The data has a rising trend.
The average number of yearly fire incidents per 10k residents in Birdsboro, PA compared to nearest cities:
(Note: Based on data for the last 3 years, including only cities with population 5,000 and above)
| Birdsboro: | 87.4 |
| Reading: | 69.4 |
| Shillington: | 50.7 |
| Pottstown: | 58.2 |
| Wyomissing: | 48.1 |
| Blandon: | 4.9 |
 The median response time based on all reported fire incidents is 9 minutes. This is higher compared to the Pennsylvania median value.
The median response time in Birdsboro, PA compared to nearest cities:
(Note: Based on data for all years, including only cities with at least 500 fire incidents)
| Birdsboro: | 9 minutes |
| Douglassville: | 8 minutes |
| Reading: | 3 minutes |
| Pottstown: | 6 minutes |
| Mohnton: | 9 minutes |
| Wyomissing: | 6 minutes |
| Boyertown: | 7 minutes |
| Sinking Spring: | 6 minutes |
| Honey Brook: | 8 minutes |
 31.9% incidents where reported in the morning and 68.1% in the evening. The most fires (18.3%) took place on Saturday, and the least (10.8%) on Tuesday.
 Based on the 520 fires from years 2003 - 2018 most fires (17.3%) took place during March, and the least (3.7%) in August.
 Out of all 2,149 cases reported during the years 2003 - 2018, the most belonged to the categories: Rescue & EMS (31.3%), Fire (24.2%), and Good Intent Call (13.7%).
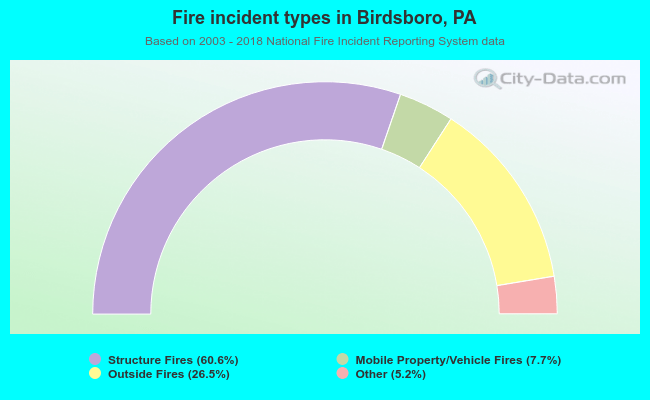 When looking into fire subcategories, the most incidents belonged to: Structure Fires (60.6%), and Outside Fires (26.5%).