Pottstown: Fire Incidents, Pennsylvania (PA)
Where are fire incidents reported in Pottstown, PA
Something went wrong! Please refresh the page.
| Fire incidents reported | |
|---|---|
| Sreet name | Count |
| HIGH ST | 438 |
| KING ST | 164 |
| SCHUYLKILL RD | 148 |
| HANOVER ST | 118 |
| CHARLOTTE ST | 72 |
| WALNUT ST | 68 |
| BEECH ST | 66 |
| CHESTNUT ST | 64 |
| BUCHERT RD | 60 |
| FARMINGTON AVE | 46 |
| FRANKLIN ST | 46 |
| KEIM ST | 46 |
| HIGH | 44 |
| EVANS ST | 42 |
| POTTSTOWN PIKE | 38 |
| CEDARVILLE RD | 36 |
| YORK ST | 36 |
| WALNUTRIDGE | 34 |
| QUEEN ST | 32 |
| SHOEMAKER RD | 30 |
| SANATOGA RD | 28 |
| COVENTRYVILLE RD | 26 |
| LAURELWOOD RD | 26 |
| SAINT PETERS RD | 26 |
| WASHINGTON ST | 26 |
| EVERGREEN RD | 24 |
| RIDGE RD | 24 |
| RT 422 | 24 |
| 422 RT | 22 |
| MANATAWNY ST | 22 |
| Other | 207 |
2003 - 2018 National Fire Incident Reporting System (NFIRS) incidents
- Incident types reported to NFIRS in Pottstown, PA
- 2,08330.7%Fire
- 2,02629.8%Hazardous Condition
- 74110.9%False Alarm
- 70310.3%Rescue & EMS
- 5868.6%Service Call
- 4276.3%Good Intent Call
- 2033.0%Special Incident
- 180.3%Severe Weather
- 70.1%Overpressure Rupture
- Fire incident types reported to NFIRS in Pottstown, PA
- 1,12754.1%Structure Fires
- 49023.5%Outside Fires
- 29614.2%Other
- 1708.2%Mobile Property/Vehicle Fires
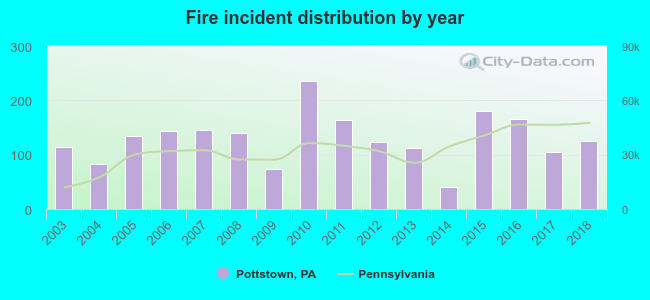 Based on the data from the years 2003 - 2018 the average number of fires per year is 130. The highest number of reported fire incidents - 236 took place in 2010, and the least - 40 in 2014. The data has a growing trend.
The average number of yearly fire incidents per 10k residents in Pottstown, PA compared to nearest cities:
(Note: Based on data for the last 3 years, including only cities with population 5,000 and above)
| Pottstown: | 58.2 |
| Birdsboro: | 87.4 |
| Phoenixville: | 65.7 |
| Collegeville: | 88.9 |
| Harleysville: | 12.9 |
| Audubon: | 30.8 |
| Trooper: | 7.5 |
| West Norriton: | 4.1 |
| Reading: | 69.4 |
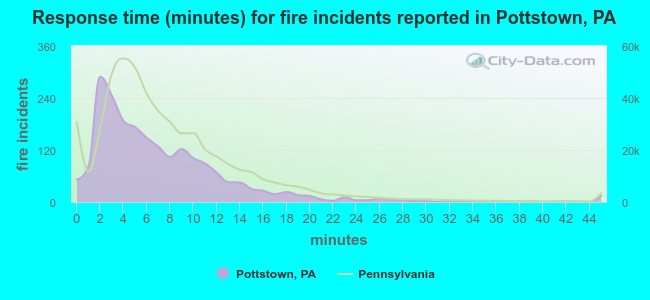 The median response time based on all reported fire incidents is 6 minutes. This is close to the state median value.
The median response time in Pottstown, PA compared to nearest cities:
(Note: Based on data for all years, including only cities with at least 500 fire incidents)
| Pottstown: | 6 minutes |
| Douglassville: | 8 minutes |
| Boyertown: | 7 minutes |
| Spring City: | 6 minutes |
| Birdsboro: | 9 minutes |
| Phoenixville: | 6 minutes |
| Exton: | 6 minutes |
| Malvern: | 9 minutes |
| Reading: | 3 minutes |
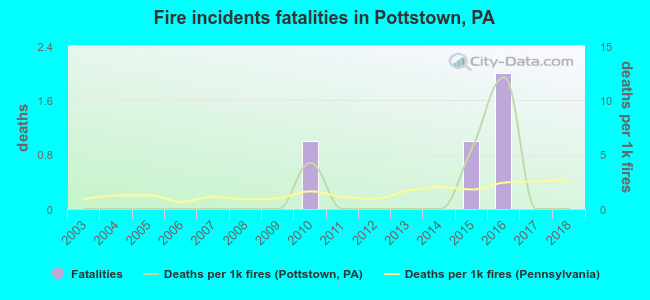 According to the reports from the years 2003 - 2018 the average number of fire-related yearly deaths is 0. The highest number of deaths - 2 took place in 2016, and the lowest - 0 in 2003. The data has a constant trend.
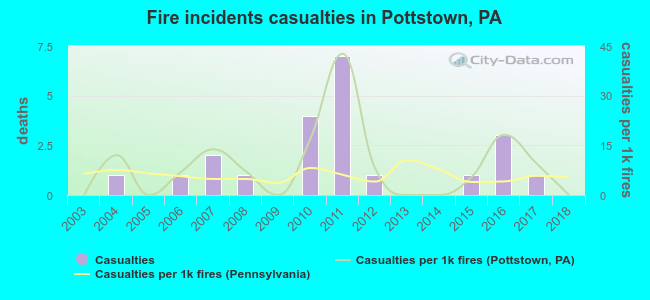 Based on the data from the years 2003 - 2018 the average number of fire-related yearly casualties is 1. The highest number of injuries - 7 took place in 2011, and the lowest - 0 in 2003. The data has a constant trend.
The average number of casualties per 1,000 fire incidents is 9. This indicator was the highest - 43 in 2011, and the lowest 0 in 2003. The trend for injuries per 1,000 incidents is increasing. Compared to the Pennsylvania value the number of casualties per 1,000 incidents is higher.
Based on the data from the years 2003 - 2018 the average number of fire-related yearly casualties is 1. The highest number of injuries - 7 took place in 2011, and the lowest - 0 in 2003. The data has a constant trend.
The average number of casualties per 1,000 fire incidents is 9. This indicator was the highest - 43 in 2011, and the lowest 0 in 2003. The trend for injuries per 1,000 incidents is increasing. Compared to the Pennsylvania value the number of casualties per 1,000 incidents is higher.Casualties per 1,000 incidents in Pottstown, PA compared to nearest cities:
(Note: Based on data for all years, including only cities with at least 500 fire incidents)
| Pottstown: | 10.6 |
| Douglassville: | 0.0 |
| Boyertown: | 9.4 |
| Spring City: | 1.6 |
| Birdsboro: | 0.0 |
| Phoenixville: | 14.0 |
| Exton: | 7.9 |
| Malvern: | 7.7 |
| Reading: | 13.6 |
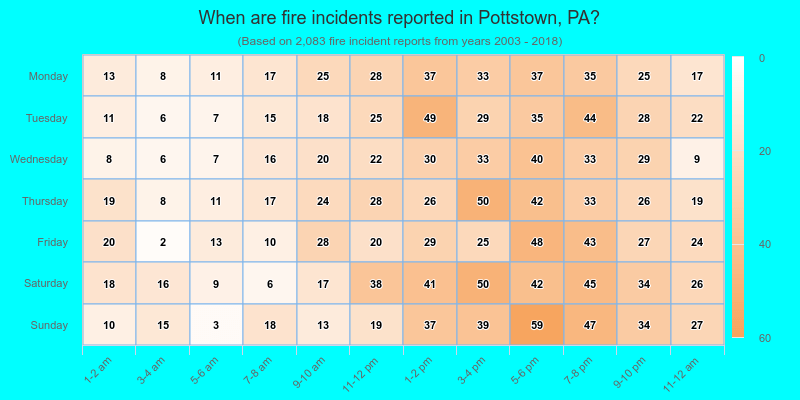
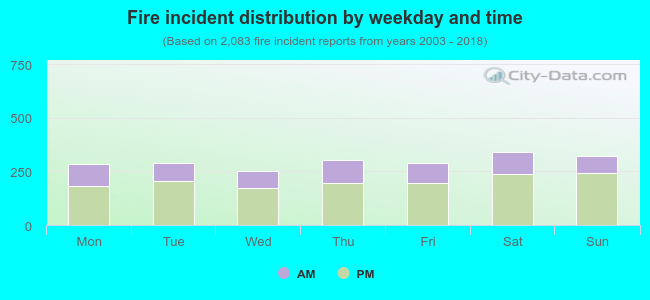 31.0% incidents where reported in the morning and 69.0% in the evening. The most fires (16.4%) took place on Saturday, and the least (12.1%) on Wednesday.
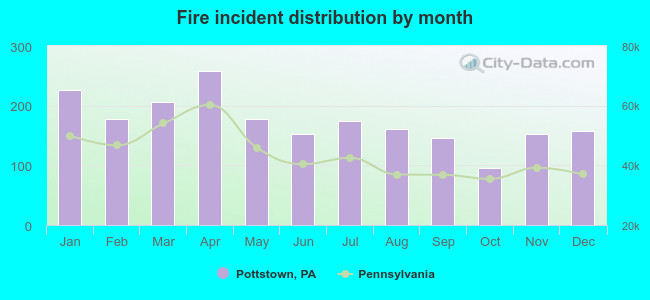 According to the 2,083 fire incidents from years 2003 - 2018 most fires (12.4%) took place during April, and the least (4.6%) in October.
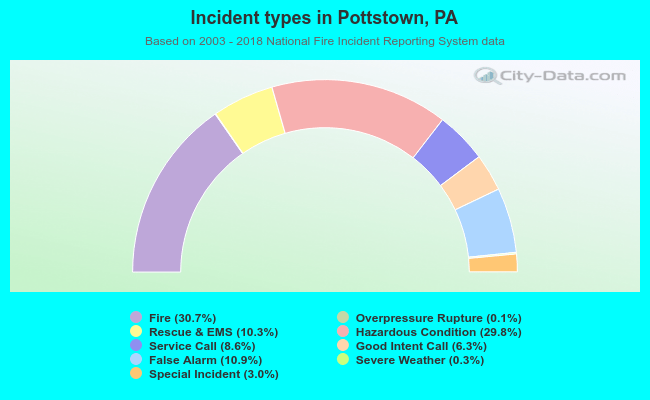 Out of all 6,794 cases reported during the years 2003 - 2018, the most belonged to the categories: Fire (30.7%), Hazardous Condition (29.8%), and False Alarm (10.9%).
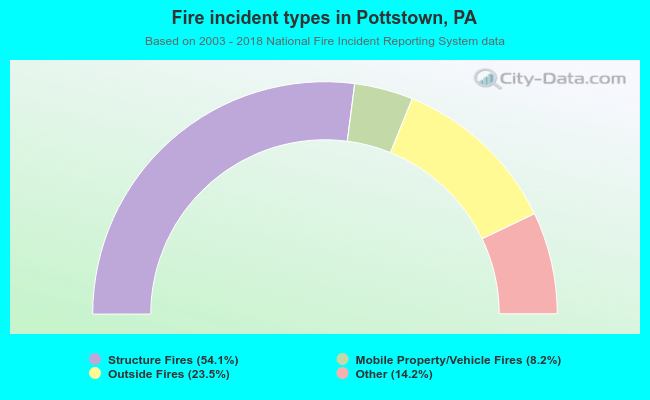 When looking into fire subcategories, the most incidents belonged to: Structure Fires (54.1%), and Outside Fires (23.5%).