Bloomington: Fire Incidents, Minnesota (MN)
Where are fire incidents reported in Bloomington, MN
Something went wrong! Please refresh the page.
| Fire incidents reported | |
|---|---|
| Sreet name | Count |
| LYNDALE AVE | 326 |
| 98 ST | 252 |
| 86 ST | 216 |
| AMERICAN BLVD | 210 |
| OLD SHAKOPEE RD | 190 |
| OLD CEDAR AVE | 150 |
| 102 ST | 142 |
| 24 AVE | 136 |
| NICOLLET AVE | 128 |
| 80 ST | 110 |
| BUSH LAKE RD | 106 |
| FRANCE AVE | 106 |
| GOODRICH RD | 92 |
| PENN AVE | 92 |
| 78 ST | 86 |
| 12 AVE | 76 |
| PORTLAND AVE | 76 |
| 84 ST | 74 |
| 90 ST | 74 |
| 82 ST | 72 |
| PARK AVE | 66 |
| BLOOMINGTON AVE | 62 |
| 96 ST | 60 |
| OAKLAND AVE | 60 |
| HARRIET AVE | 58 |
| HERITAGE HILLS DR | 58 |
| OUTOFAREA WAY | 58 |
| 95 ST | 54 |
| SOUTHTOWN CTR | 54 |
| WENTWORTH AVE | 54 |
| Other | 96 |
2004 - 2018 National Fire Incident Reporting System (NFIRS) incidents
- Incident types reported to NFIRS in Bloomington, MN
- 3,39430.3%Fire
- 2,65623.7%Hazardous Condition
- 2,10218.8%False Alarm
- 1,39512.5%Rescue & EMS
- 9258.3%Good Intent Call
- 6906.2%Service Call
- 160.1%Severe Weather
- Fire incident types reported to NFIRS in Bloomington, MN
- 1,99458.8%Structure Fires
- 68020.0%Outside Fires
- 67519.9%Mobile Property/Vehicle Fires
- 451.3%Other
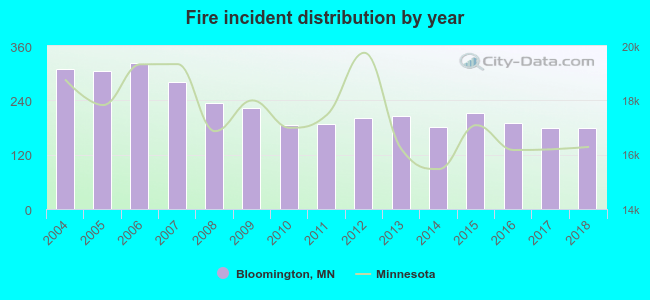 Based on the data from the years 2004 - 2018 the average number of fire incidents per year is 226. The highest number of fires - 322 took place in 2006, and the least - 178 in 2018. The data has a declining trend.
The average number of yearly fire incidents per 10k residents in Bloomington, MN compared to nearest cities:
(Note: Based on data for the last 3 years, including only cities with population 5,000 and above)
| Bloomington: | 21.2 |
| Richfield: | 20.8 |
| Edina: | 18.1 |
| Burnsville: | 19.6 |
| Savage: | 9.7 |
| Eagan: | 12.1 |
| Eden Prairie: | 15.2 |
| Hopkins: | 30.1 |
| Apple Valley: | 16.2 |
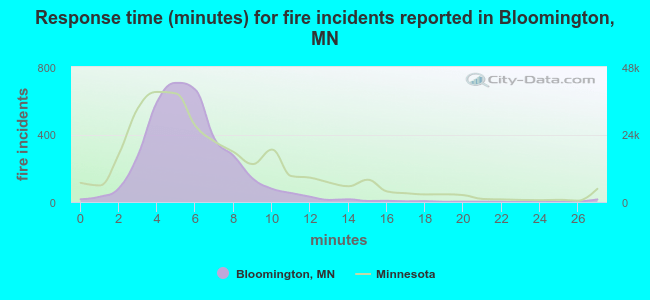 The median response time based on all reported fire incidents is 5 minutes. This is lower than the state median value.
The median response time in Bloomington, MN compared to nearest cities:
(Note: Based on data for all years, including only cities with at least 500 fire incidents)
| Bloomington: | 5 minutes |
| Richfield: | 4 minutes |
| Edina: | 5 minutes |
| Burnsville: | 6 minutes |
| Savage: | 5 minutes |
| Eagan: | 6 minutes |
| Eden Prairie: | 6 minutes |
| Hopkins: | 5 minutes |
| Apple Valley: | 5 minutes |
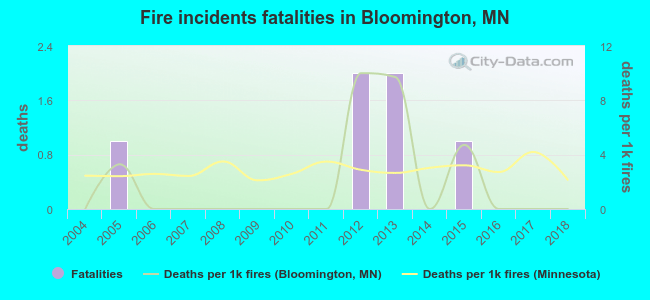 Based on the data from the years 2004 - 2018 the average number of fire-related yearly deaths is 0. The highest number of deaths - 2 took place in 2012, and the lowest - 0 in 2004. The data has a constant trend.
The average number of fatalities per 1,000 fire incidents is 2. This indicator was the highest - 10 in 2012, and the lowest 0 in 2004. The trend for fatalities per 1,000 fire incidents is constant. Compared to the state value the number of deaths per 1,000 fire incidents is lower.
Based on the data from the years 2004 - 2018 the average number of fire-related yearly deaths is 0. The highest number of deaths - 2 took place in 2012, and the lowest - 0 in 2004. The data has a constant trend.
The average number of fatalities per 1,000 fire incidents is 2. This indicator was the highest - 10 in 2012, and the lowest 0 in 2004. The trend for fatalities per 1,000 fire incidents is constant. Compared to the state value the number of deaths per 1,000 fire incidents is lower.Deaths per 1,000 incidents in Bloomington, MN compared to nearest cities:
(Note: Based on data for all years, including only cities with at least 2,500 fire incidents)
| Bloomington: | 1.8 |
| Burnsville: | 2.0 |
| Minneapolis: | 3.6 |
| Plymouth: | 0.3 |
| Brooklyn Park: | 1.1 |
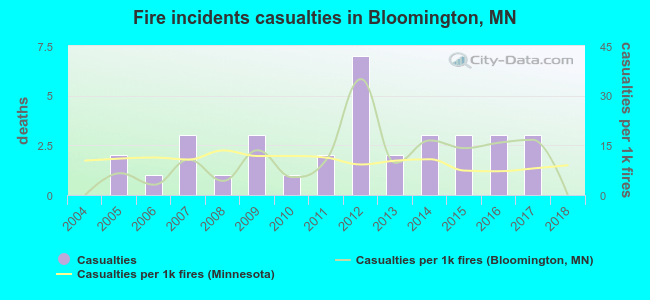 According to the reports from the years 2004 - 2018 the average number of fire-related yearly casualties is 2. The highest number of casualties - 7 took place in 2012, and the lowest - 0 in 2004. The data has a constant trend.
The average number of casualties per 1,000 fires is 11. This indicator was the highest - 35 in 2012, and the lowest 0 in 2004. The trend for injuries per 1,000 incidents is increasing. Compared to the Minnesota value the number of casualties per 1,000 incidents is about the same.
According to the reports from the years 2004 - 2018 the average number of fire-related yearly casualties is 2. The highest number of casualties - 7 took place in 2012, and the lowest - 0 in 2004. The data has a constant trend.
The average number of casualties per 1,000 fires is 11. This indicator was the highest - 35 in 2012, and the lowest 0 in 2004. The trend for injuries per 1,000 incidents is increasing. Compared to the Minnesota value the number of casualties per 1,000 incidents is about the same.Casualties per 1,000 incidents in Bloomington, MN compared to nearest cities:
(Note: Based on data for all years, including only cities with at least 500 fire incidents)
| Bloomington: | 10.0 |
| Richfield: | 20.5 |
| Edina: | 40.5 |
| Burnsville: | 33.4 |
| Savage: | 11.5 |
| Eagan: | 7.3 |
| Eden Prairie: | 22.6 |
| Hopkins: | 17.8 |
| Apple Valley: | 18.8 |
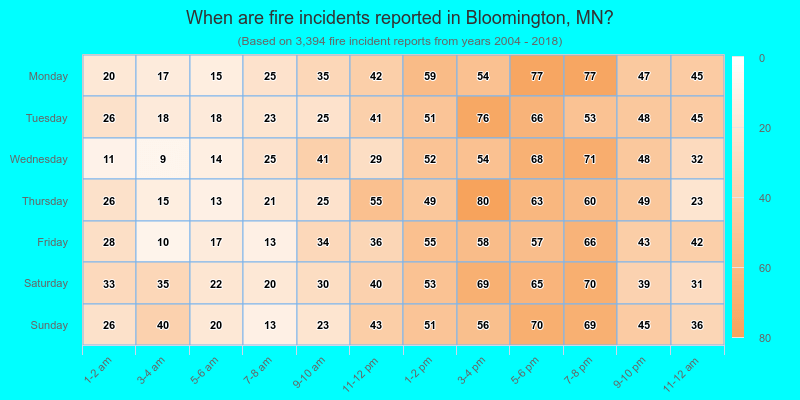
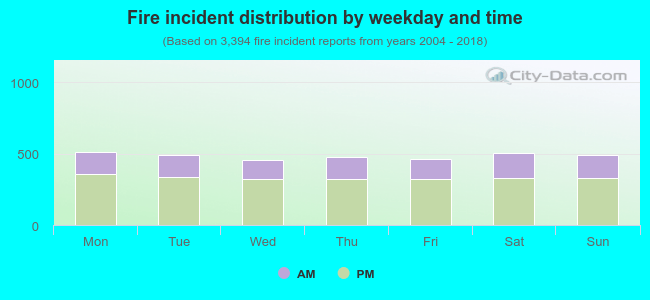 31.6% incidents where reported in the morning and 68.4% in the evening. The most fires (15.1%) took place on Monday, and the least (13.4%) on Wednesday.
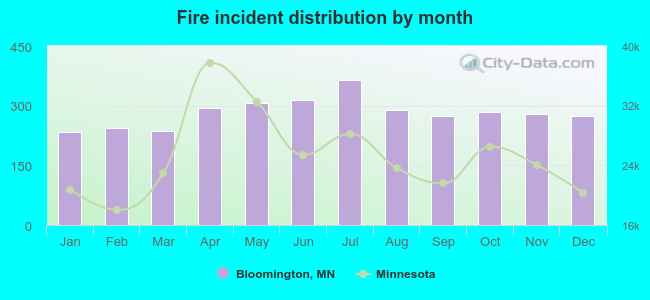 According to the 3,394 reports from years 2004 - 2018 most fires (10.7%) took place during July, and the least (6.9%) in January.
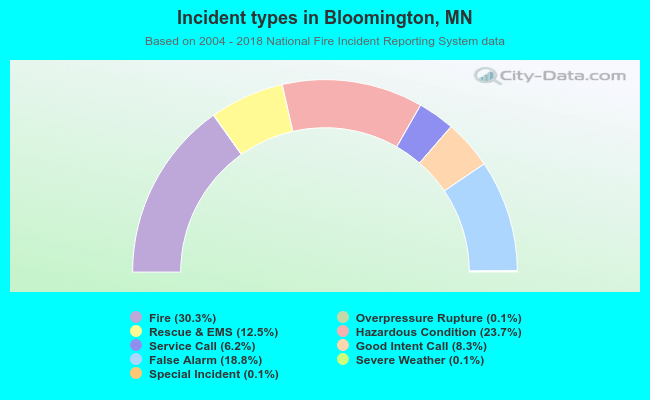 Out of all 11,193 cases reported during the years 2004 - 2018, the most belonged to the categories: Fire (30.3%), Hazardous Condition (23.7%), and False Alarm (18.8%).
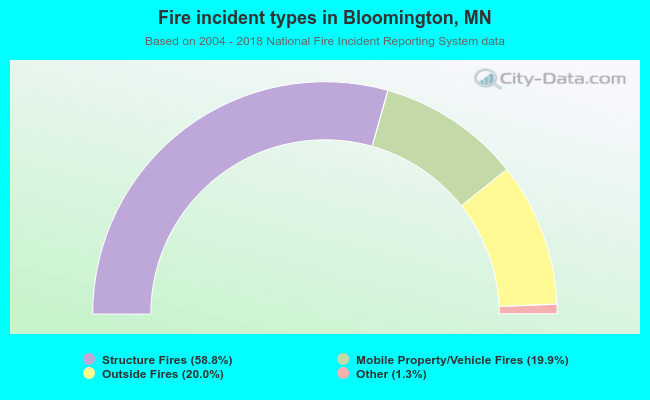 When looking into fire subcategories, the most reports belonged to: Structure Fires (58.8%), and Outside Fires (20.0%).