Edina: Fire Incidents, Minnesota (MN)
Where are fire incidents reported in Edina, MN
Something went wrong! Please refresh the page.
| Fire incidents reported | |
|---|---|
| Sreet name | Count |
| FRANCE AVE | 190 |
| YORK AVE | 174 |
| PARKLAWN AVE | 98 |
| HIGHWAY 100 | 90 |
| VERNON AVE | 78 |
| HIGHWAY 62 | 64 |
| VALLEY VIEW RD | 62 |
| SOUTHDALE CENTER | 56 |
| GALLAGHER DR | 46 |
| HIGHWAY 169 | 44 |
| CAHILL RD | 42 |
| LINCOLN DR | 38 |
| XERXES AVE | 38 |
| EDINBOROUGH WAY | 34 |
| 70TH ST | 30 |
| HERITAGE DR | 30 |
| WOODDALE AVE | 28 |
| 50TH ST | 26 |
| SUNNYSIDE RD | 26 |
| WEST SHORE DR | 26 |
| JEFFERSON AVE | 24 |
| 66TH ST | 22 |
| GLEASON RD | 22 |
| 77TH ST | 20 |
| BARRIE RD | 20 |
| CORNELIA DR | 20 |
| GRIMES AVE | 20 |
| SHANNON DR | 20 |
| SOUTHDALE CTR | 20 |
| TRACY AVE | 20 |
| Other | 251 |
2002 - 2018 National Fire Incident Reporting System (NFIRS) incidents
- Incident types reported to NFIRS in Edina, MN
- 22,49870.0%Rescue & EMS
- 2,5347.9%False Alarm
- 2,5217.8%Good Intent Call
- 2,0356.3%Hazardous Condition
- 1,6795.2%Fire
- 8072.5%Service Call
- Fire incident types reported to NFIRS in Edina, MN
- 1,03961.9%Structure Fires
- 34920.8%Outside Fires
- 26816.0%Mobile Property/Vehicle Fires
- 231.4%Other
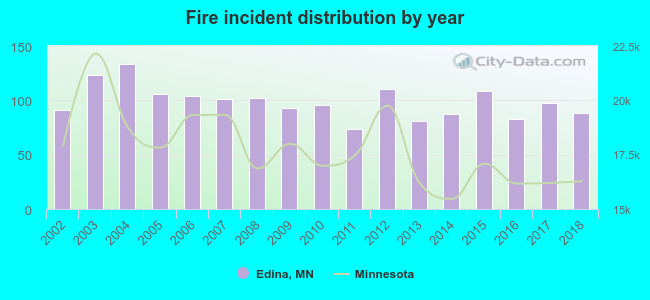 Based on the data from the years 2002 - 2018 the average number of fire incidents per year is 99. The highest number of reported fire incidents - 133 took place in 2004, and the least - 74 in 2011. The data has a decreasing trend.
The average number of yearly fire incidents per 10k residents in Edina, MN compared to nearest cities:
(Note: Based on data for the last 3 years, including only cities with population 5,000 and above)
| Edina: | 18.1 |
| Hopkins: | 30.1 |
| Richfield: | 20.8 |
| Bloomington: | 21.2 |
| Minnetonka: | 14.6 |
| Eden Prairie: | 15.2 |
| Minneapolis: | 24.5 |
| Golden Valley: | 25.9 |
| Robbinsdale: | 31.4 |
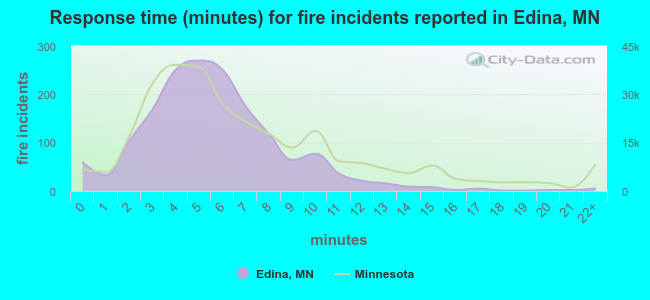 The median response time based on all reported fire incidents is 5 minutes. This is lower than the Minnesota median value.
The median response time in Edina, MN compared to nearest cities:
(Note: Based on data for all years, including only cities with at least 500 fire incidents)
| Edina: | 5 minutes |
| Hopkins: | 5 minutes |
| St. Louis Park: | 5 minutes |
| Richfield: | 4 minutes |
| Bloomington: | 5 minutes |
| Minnetonka: | 7 minutes |
| Eden Prairie: | 6 minutes |
| Minneapolis: | 4 minutes |
| Golden Valley: | 7 minutes |
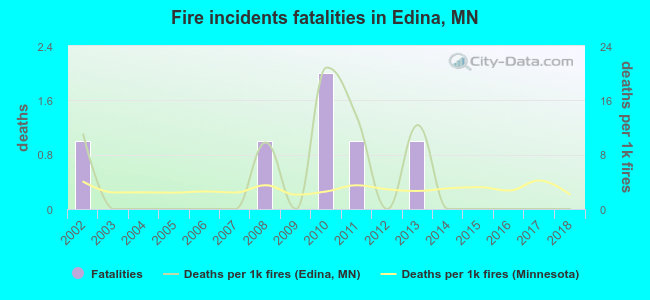 Based on the data from the years 2002 - 2018 the average number of fire-related yearly deaths is 0. The highest number of reported deaths - 2 took place in 2010, and the lowest - 0 in 2003. The data has a decreasing trend.
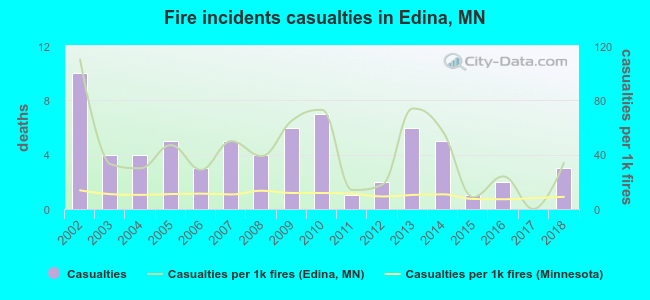 According to the reports from the years 2002 - 2018 the average number of fire-related casualties per year is 4. The highest number of injuries - 10 took place in 2002, and the lowest - 0 in 2017. The data has a dropping trend.
The average number of injuries per 1,000 fires is 42. This indicator was the highest - 110 in 2002, and the lowest 0 in 2017. The trend for injuries per 1,000 fires is declining. Compared to the Minnesota value the number of injuries per 1,000 fires is much higher.
According to the reports from the years 2002 - 2018 the average number of fire-related casualties per year is 4. The highest number of injuries - 10 took place in 2002, and the lowest - 0 in 2017. The data has a dropping trend.
The average number of injuries per 1,000 fires is 42. This indicator was the highest - 110 in 2002, and the lowest 0 in 2017. The trend for injuries per 1,000 fires is declining. Compared to the Minnesota value the number of injuries per 1,000 fires is much higher.Casualties per 1,000 incidents in Edina, MN compared to nearest cities:
(Note: Based on data for all years, including only cities with at least 500 fire incidents)
| Edina: | 40.5 |
| Hopkins: | 17.8 |
| St. Louis Park: | 32.2 |
| Richfield: | 20.5 |
| Bloomington: | 10.0 |
| Minnetonka: | 20.8 |
| Eden Prairie: | 22.6 |
| Minneapolis: | 17.0 |
| Golden Valley: | 2.1 |
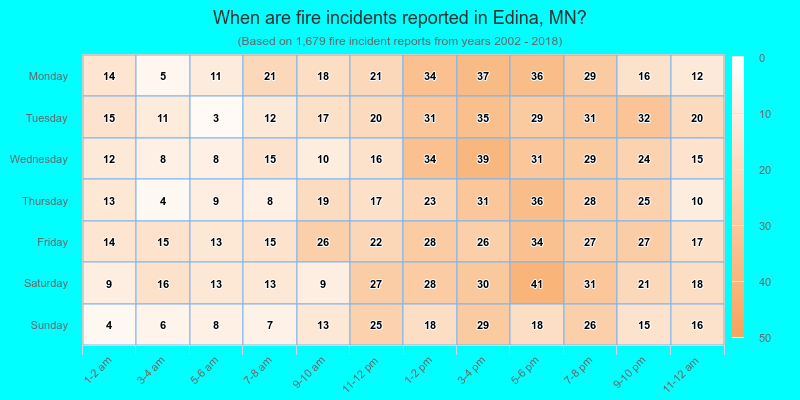
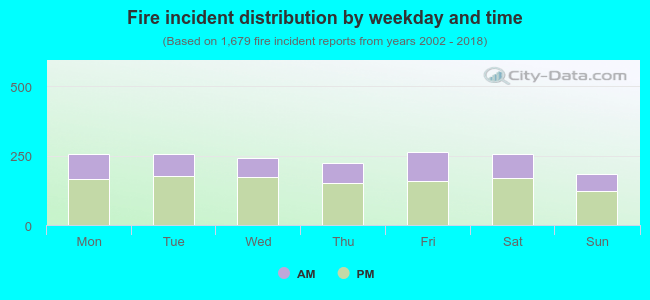 33.5% incidents where reported in the morning and 66.5% in the evening. The most fires (15.7%) took place on Friday, and the least (11.0%) on Sunday.
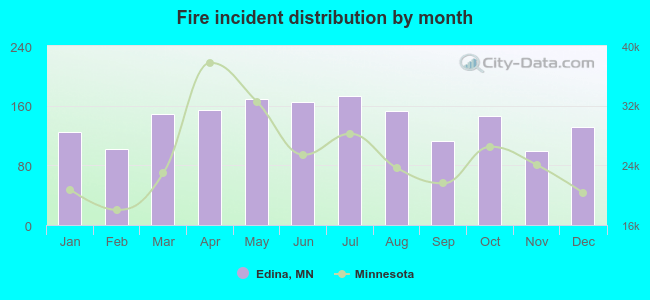 Based on the 1,679 fire incident reports from years 2002 - 2018 most fires (10.3%) took place during July, and the least (5.9%) in November.
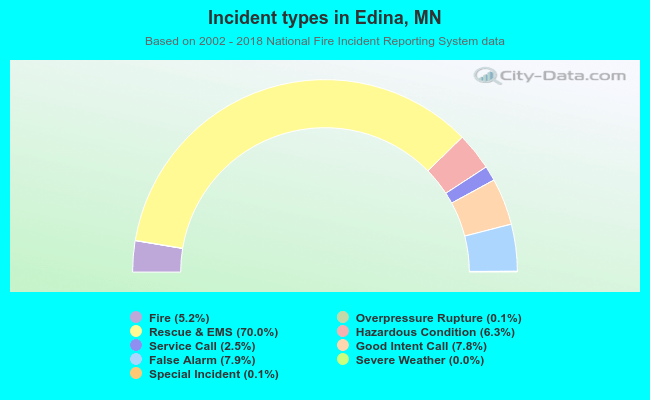 Out of all 32,125 cases reported during the years 2002 - 2018, the most belonged to the categories: Rescue & EMS (70.0%), False Alarm (7.9%), and Good Intent Call (7.8%).
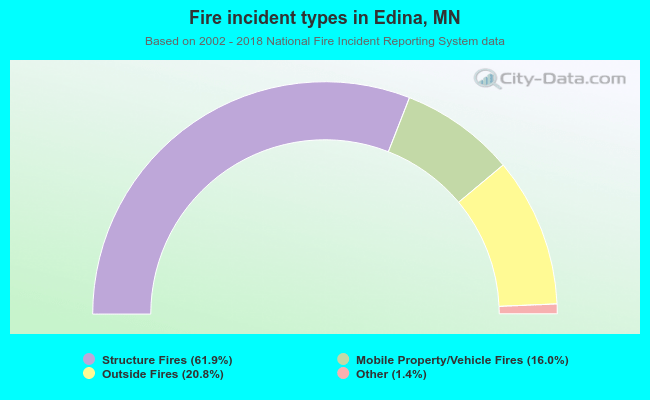 When looking into fire subcategories, the most reports belonged to: Structure Fires (61.9%), and Outside Fires (20.8%).