Bloomsburg: Fire Incidents, Pennsylvania (PA)
Where are fire incidents reported in Bloomsburg, PA
Something went wrong! Please refresh the page.
|
| |||||||||||||||||||||||||||||||||||||||||||||||||||||||||||||||||||||||||||||||||||||||||||||||||||||||||||||
2004 - 2018 National Fire Incident Reporting System (NFIRS) incidents
- Incident types reported to NFIRS in Bloomsburg, PA
- 83328.7%Fire
- 55519.1%Rescue & EMS
- 49116.9%False Alarm
- 43314.9%Hazardous Condition
- 2247.7%Good Intent Call
- 2127.3%Service Call
- 1404.8%Special Incident
- 130.4%Severe Weather
- Fire incident types reported to NFIRS in Bloomsburg, PA
- 48958.7%Structure Fires
- 16920.3%Outside Fires
- 13716.4%Mobile Property/Vehicle Fires
- 384.6%Other
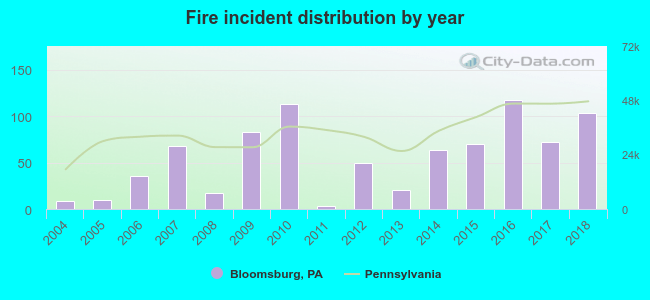 According to the data from the years 2004 - 2018 the average number of fires per year is 56. The highest number of reported fire incidents - 117 took place in 2016, and the least - 3 in 2011. The data has a rising trend.
The average number of yearly fire incidents per 10k residents in Bloomsburg, PA compared to nearest cities:
(Note: Based on data for the last 3 years, including only cities with population 5,000 and above)
| Bloomsburg: | 66.1 |
| Berwick: | 47.8 |
| Mount Carmel: | 32.8 |
| Shamokin: | 38.7 |
| Sunbury: | 34.9 |
| Milton: | 30.6 |
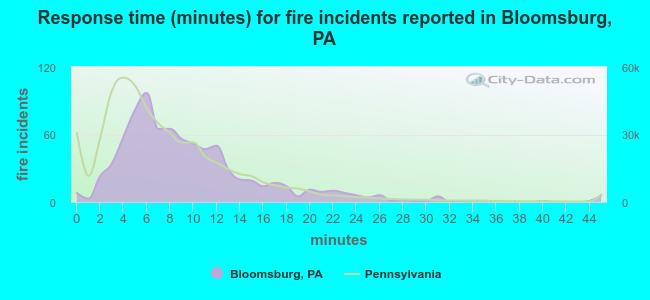 The median response time based on all reported fire incidents is 8 minutes. This is higher compared to the Pennsylvania median value.
The median response time in Bloomsburg, PA compared to nearest cities:
(Note: Based on data for all years, including only cities with at least 500 fire incidents)
| Bloomsburg: | 8 minutes |
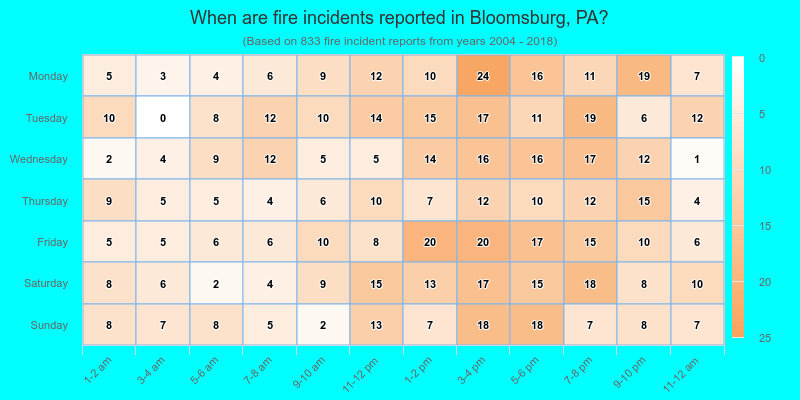
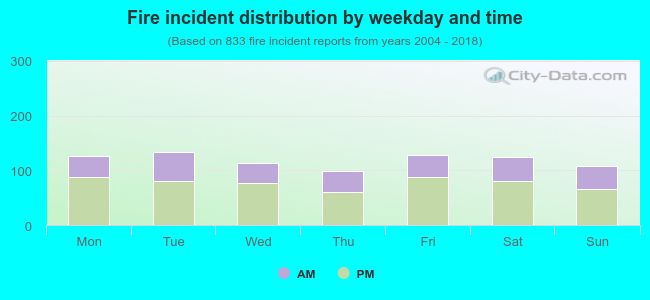 35.5% incidents where reported in the morning and 64.5% in the evening. The most fires (16.1%) took place on Tuesday, and the least (11.9%) on Thursday.
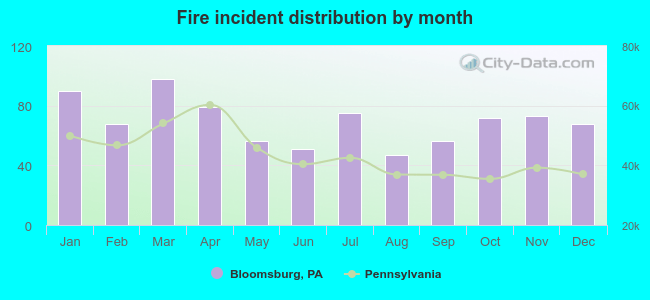 Based on the 833 fires from years 2004 - 2018 most fires (11.8%) took place during March, and the least (5.6%) in August.
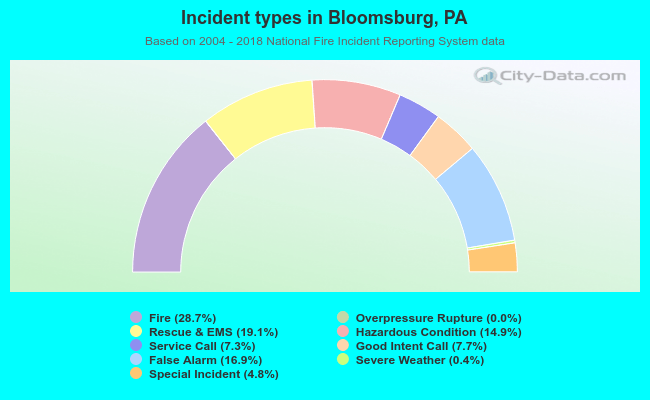 Out of all 2,902 cases reported during the years 2004 - 2018, the most belonged to the categories: Fire (28.7%), Rescue & EMS (19.1%), and False Alarm (16.9%).
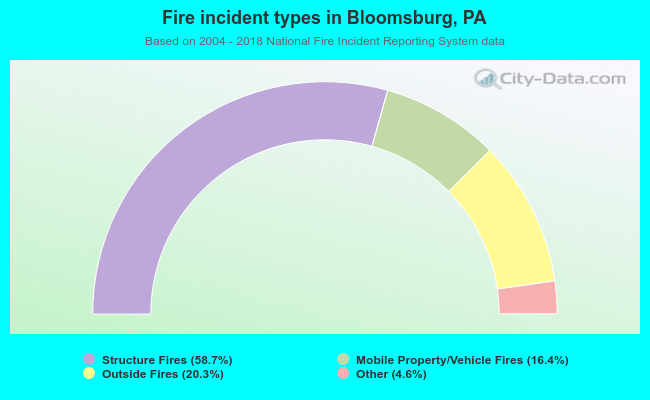 When looking into fire subcategories, the most incidents belonged to: Structure Fires (58.7%), and Outside Fires (20.3%).