Sunbury: Fire Incidents, Pennsylvania (PA)
Where are fire incidents reported in Sunbury, PA
Something went wrong! Please refresh the page.
|
| |||||||||||||||||||||||||||||||||||||||||||||||||||||||||||||||||||||||||||||||||||||||||||||||||||||||||||||
2004 - 2018 National Fire Incident Reporting System (NFIRS) incidents
- Incident types reported to NFIRS in Sunbury, PA
- 35731.6%Fire
- 29426.1%Hazardous Condition
- 15213.5%Rescue & EMS
- 13211.7%Good Intent Call
- 837.4%Service Call
- 807.1%False Alarm
- 232.0%Special Incident
- 70.6%Severe Weather
- Fire incident types reported to NFIRS in Sunbury, PA
- 23465.5%Structure Fires
- 5314.8%Other
- 5114.3%Outside Fires
- 195.3%Mobile Property/Vehicle Fires
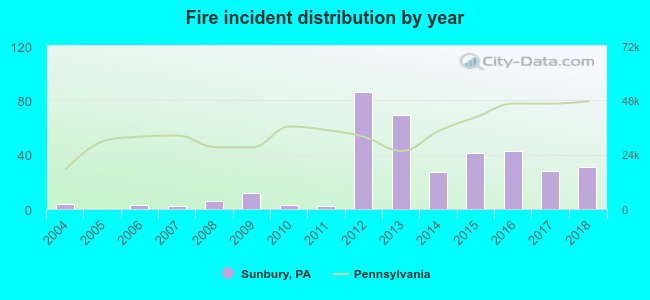 Based on the data from the years 2004 - 2018 the average number of fires per year is 24. The highest number of reported fires - 86 took place in 2012, and the least - 0 in 2005. The data has a rising trend.
The average number of yearly fire incidents per 10k residents in Sunbury, PA compared to nearest cities:
(Note: Based on data for the last 3 years, including only cities with population 5,000 and above)
| Sunbury: | 34.9 |
| Selinsgrove: | 29.4 |
| Lewisburg: | 39.8 |
| Milton: | 30.6 |
| Shamokin: | 38.7 |
| Bloomsburg: | 66.1 |
| Mount Carmel: | 32.8 |
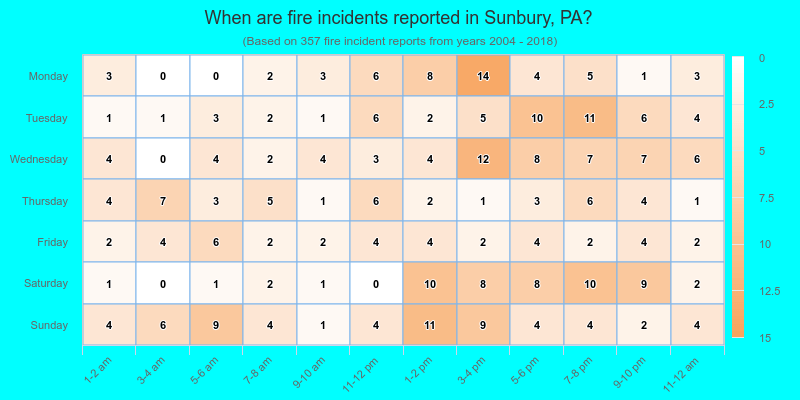
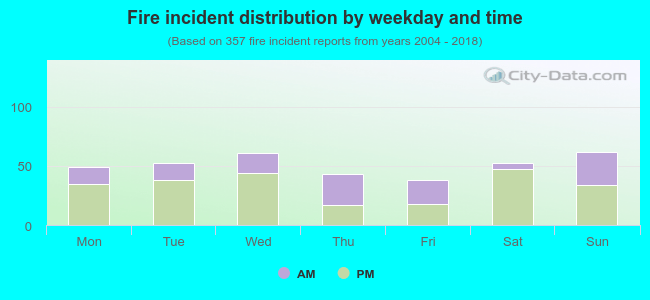 34.7% incidents where reported in the morning and 65.3% in the evening. The most fires (17.4%) took place on Sunday, and the least (10.6%) on Friday.
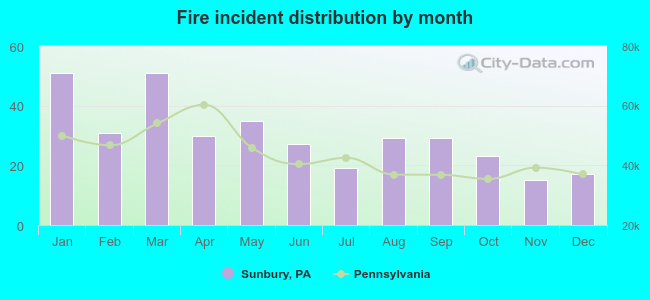 Based on the 357 fire incidents from years 2004 - 2018 most fires (14.3%) took place during January, and the least (4.2%) in November.
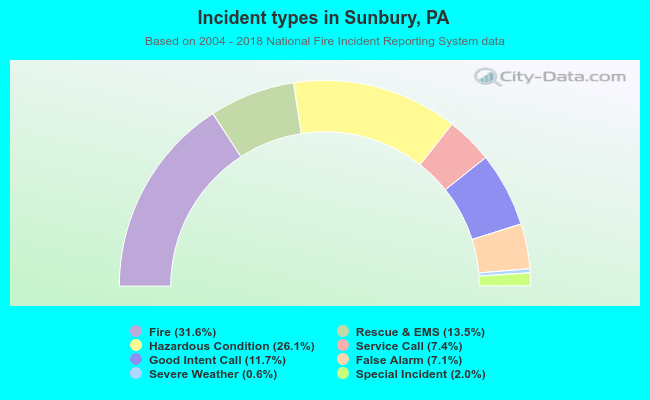 Out of all 1,128 cases reported during the years 2004 - 2018, the most belonged to the categories: Fire (31.6%), Rescue & EMS (26.1%), and Overpressure Rupture (13.5%).
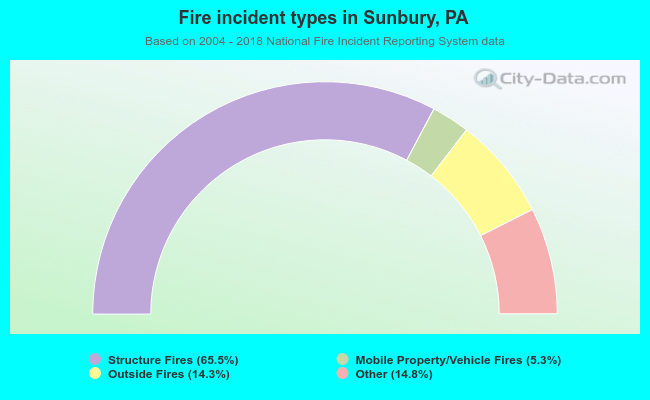 When looking into fire subcategories, the most reports belonged to: Structure Fires (65.5%), and Other (14.8%).