Shamokin: Fire Incidents, Pennsylvania (PA)
Where are fire incidents reported in Shamokin, PA
Something went wrong! Please refresh the page.
|
| |||||||||||||||||||||||||||||||||||||||||||||||||||||||||||||||||||||||||||||||||||||||||||||||||||||||||||||
2004 - 2018 National Fire Incident Reporting System (NFIRS) incidents
- Incident types reported to NFIRS in Shamokin, PA
- 32434.1%Fire
- 19620.6%Hazardous Condition
- 11712.3%Rescue & EMS
- 11512.1%False Alarm
- 10410.9%Good Intent Call
- 778.1%Service Call
- 90.9%Special Incident
- 50.5%Overpressure Rupture
- 40.4%Severe Weather
- Fire incident types reported to NFIRS in Shamokin, PA
- 18657.4%Structure Fires
- 7623.5%Outside Fires
- 4714.5%Other
- 154.6%Mobile Property/Vehicle Fires
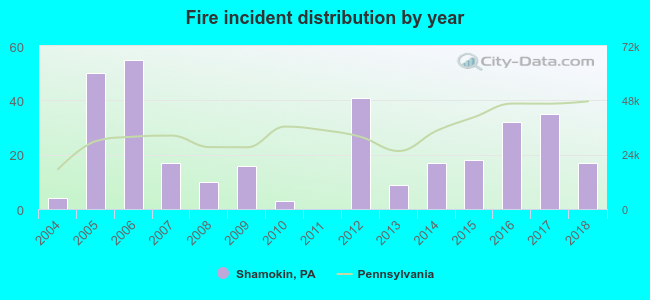 According to the data from the years 2004 - 2018 the average number of fires per year is 22. The highest number of fire incidents - 55 took place in 2006, and the least - 0 in 2011. The data has an increasing trend.
The average number of yearly fire incidents per 10k residents in Shamokin, PA compared to nearest cities:
(Note: Based on data for the last 3 years, including only cities with population 5,000 and above)
| Shamokin: | 38.7 |
| Mount Carmel: | 32.8 |
| Sunbury: | 34.9 |
| Bloomsburg: | 66.1 |
| Selinsgrove: | 29.4 |
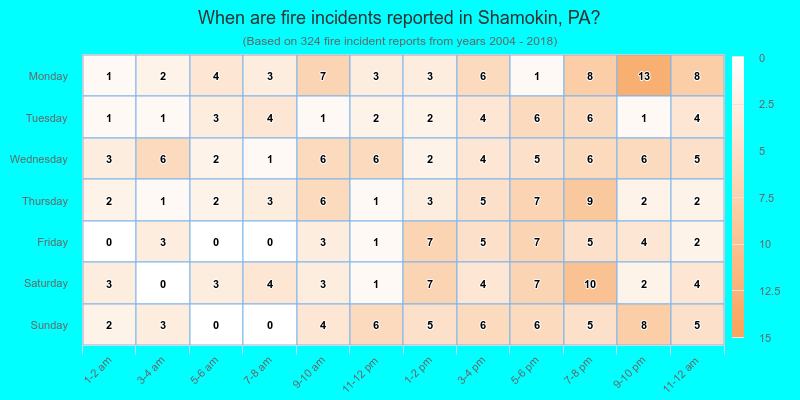
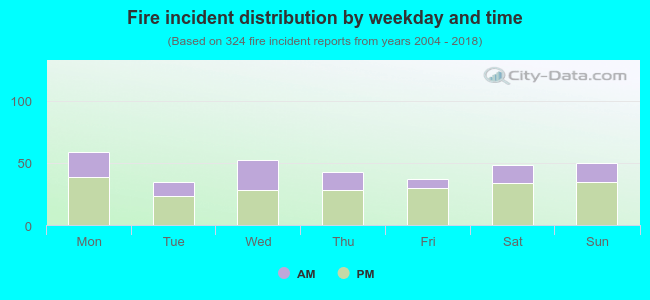 33.0% incidents where reported in the morning and 67.0% in the evening. The most fires (18.2%) took place on Monday, and the least (10.8%) on Tuesday.
 Based on the 324 fires from years 2004 - 2018 most fires (17.3%) took place during April, and the least (4.9%) in July.
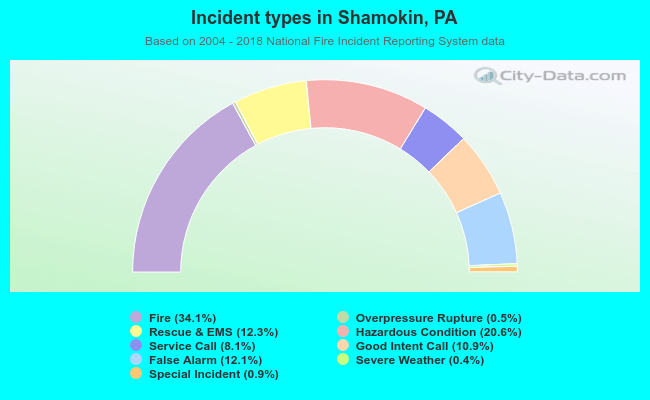 Out of all 951 cases reported during the years 2004 - 2018, the most belonged to the categories: Fire (34.1%), Hazardous Condition (20.6%), and Rescue & EMS (12.3%).
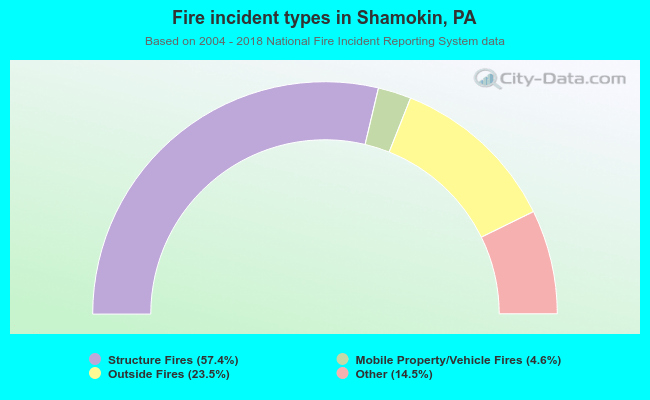 When looking into fire subcategories, the most reports belonged to: Structure Fires (57.4%), and Outside Fires (23.5%).