Bourbonnais: Fire Incidents, Illinois (IL)
Where are fire incidents reported in Bourbonnais, IL
Something went wrong! Please refresh the page.
| Fire incidents reported | |
|---|---|
| Sreet name | Count |
| ARMOUR RD | 100 |
| ST RT 50 | 74 |
| STADIUM DR | 70 |
| ARTHUR BURCH DR | 68 |
| CONVENT ST | 56 |
| MAIN ST | 52 |
| RT.50 | 48 |
| GETTYSBURG | 44 |
| STATE ROUTE 50 | 44 |
| GETTYSBURG DR | 40 |
| 50 | 34 |
| 5000N RD | 34 |
| 6000N RD | 34 |
| BERRY LN | 34 |
| KENNEDY DR | 30 |
| WILLIAM LATHAM DR | 30 |
| 3000N RD | 28 |
| BIG CHIEF DR | 28 |
| MOHAWK DR | 28 |
| RIVER ST | 28 |
| 1000N RD | 26 |
| JOHN CASEY | 26 |
| STATE RT 50 | 26 |
| 1000W RD | 24 |
| HERITAGE | 24 |
| LARRY POWER RD | 24 |
| RT. 50 | 24 |
| STRATFORD DR | 24 |
| ROUTE 50 | 22 |
| UNIVERSITY AVE | 22 |
| Other | 640 |
2002 - 2018 National Fire Incident Reporting System (NFIRS) incidents
- Incident types reported to NFIRS in Bourbonnais, IL
- 12,11460.4%Rescue & EMS
- 1,7868.9%Fire
- 1,6128.0%Hazardous Condition
- 1,6088.0%Service Call
- 1,5827.9%False Alarm
- 1,3126.5%Good Intent Call
- Fire incident types reported to NFIRS in Bourbonnais, IL
- 90750.8%Structure Fires
- 55631.1%Outside Fires
- 23813.3%Mobile Property/Vehicle Fires
- 854.8%Other
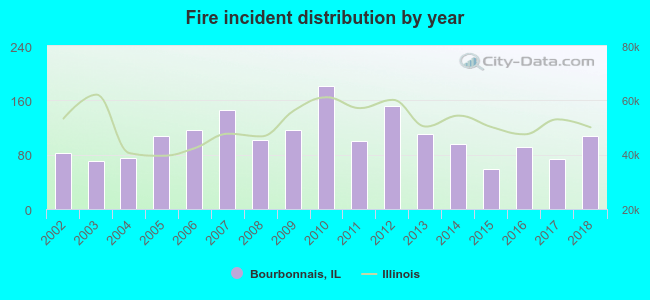 According to the data from the years 2002 - 2018 the average number of fire incidents per year is 105. The highest number of fire incidents - 181 took place in 2010, and the least - 59 in 2015. The data has an increasing trend.
The average number of yearly fire incidents per 10k residents in Bourbonnais, IL compared to nearest cities:
(Note: Based on data for the last 3 years, including only cities with population 5,000 and above)
| Bourbonnais: | 49.1 |
| Bradley: | 35.3 |
| Kankakee: | 93.8 |
| Manteno: | 77.2 |
| Wilmington: | 146.5 |
| Manhattan: | 60.7 |
| Monee: | 131.9 |
| Braidwood: | 46.3 |
| University Park: | 72.8 |
 The median response time based on all reported fire incidents is 6 minutes. This is similar to the Illinois median value.
The median response time in Bourbonnais, IL compared to nearest cities:
(Note: Based on data for all years, including only cities with at least 500 fire incidents)
| Bourbonnais: | 6 minutes |
| Bradley: | 6 minutes |
| Kankakee: | 4 minutes |
| Manteno: | 8 minutes |
| Momence: | 10 minutes |
| Peotone: | 8 minutes |
| St. Anne: | 11 minutes |
| Grant Park: | 8 minutes |
| Hopkins Park: | 17 minutes |
 According to the data from the years 2002 - 2018 the average number of fire-related yearly casualties is 1. The highest number of reported injuries - 6 took place in 2007, and the lowest - 0 in 2005. The data has a declining trend.
The average number of injuries per 1,000 fire incidents is 11. This indicator was the highest - 48 in 2002, and the lowest 0 in 2005. The trend for injuries per 1,000 incidents is dropping. Compared to the state value the number of casualties per 1,000 fires is about the same.
According to the data from the years 2002 - 2018 the average number of fire-related yearly casualties is 1. The highest number of reported injuries - 6 took place in 2007, and the lowest - 0 in 2005. The data has a declining trend.
The average number of injuries per 1,000 fire incidents is 11. This indicator was the highest - 48 in 2002, and the lowest 0 in 2005. The trend for injuries per 1,000 incidents is dropping. Compared to the state value the number of casualties per 1,000 fires is about the same.Casualties per 1,000 incidents in Bourbonnais, IL compared to nearest cities:
(Note: Based on data for all years, including only cities with at least 500 fire incidents)
| Bourbonnais: | 9.5 |
| Bradley: | 0.9 |
| Kankakee: | 22.5 |
| Manteno: | 3.0 |
| Momence: | 0.0 |
| Peotone: | 12.6 |
| St. Anne: | 0.0 |
| Grant Park: | 4.5 |
| Hopkins Park: | 0.0 |
 32.9% incidents where reported in the morning and 67.1% in the evening. The most fires (15.3%) took place on Tuesday, and the least (12.9%) on Saturday.
 Based on the 1,786 reports from years 2002 - 2018 most fires (10.5%) took place during July, and the least (6.3%) in February.
 Out of all 20,042 cases reported during the years 2002 - 2018, the most belonged to the categories: Rescue & EMS (60.4%), Fire (8.9%), and Hazardous Condition (8.0%).
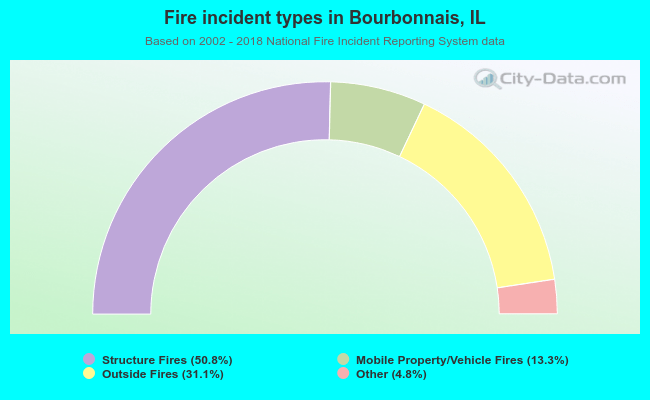 When looking into fire subcategories, the most incidents belonged to: Structure Fires (50.8%), and Outside Fires (31.1%).