Braidwood: Fire Incidents, Illinois (IL)
Where are fire incidents reported in Braidwood, IL
Something went wrong! Please refresh the page.
|
| |||||||||||||||||||||||||||||||||||||||||||||||||||||||||||||||||||||||||||||||||||||||||||||||||||||||||||||
2003 - 2018 National Fire Incident Reporting System (NFIRS) incidents
- Incident types reported to NFIRS in Braidwood, IL
- 2,88057.1%Rescue & EMS
- 58111.5%Hazardous Condition
- 57311.4%Fire
- 54310.8%Service Call
- 3406.7%Good Intent Call
- 1102.2%False Alarm
- 170.3%Special Incident
- Fire incident types reported to NFIRS in Braidwood, IL
- 29451.3%Structure Fires
- 15827.6%Outside Fires
- 6511.3%Other
- 569.8%Mobile Property/Vehicle Fires
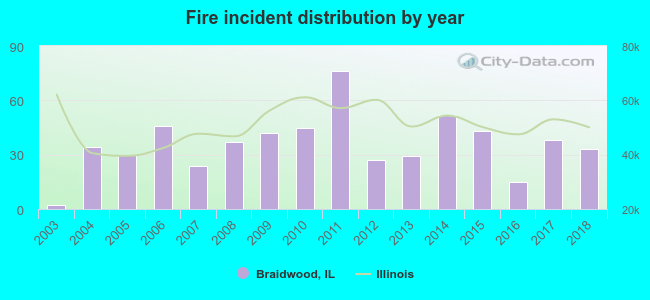 According to the data from the years 2003 - 2018 the average number of fire incidents per year is 36. The highest number of reported fires - 76 took place in 2011, and the least - 2 in 2003. The data has an increasing trend.
The average number of yearly fire incidents per 10k residents in Braidwood, IL compared to nearest cities:
(Note: Based on data for the last 3 years, including only cities with population 5,000 and above)
| Braidwood: | 46.3 |
| Coal City: | 71.2 |
| Wilmington: | 146.5 |
| Channahon: | 43.1 |
| Morris: | 101.4 |
| Minooka: | 54.8 |
| Manhattan: | 60.7 |
| Shorewood: | 36.6 |
| Joliet: | 28.1 |
 The median response time based on all reported fire incidents is 6 minutes. This is comparable to the state median value.
The median response time in Braidwood, IL compared to nearest cities:
(Note: Based on data for all years, including only cities with at least 500 fire incidents)
| Braidwood: | 6 minutes |
| Coal City: | 7 minutes |
| Wilmington: | 9 minutes |
| Elwood: | 7 minutes |
| Channahon: | 7 minutes |
| Morris: | 9 minutes |
| Minooka: | 7 minutes |
| Manhattan: | 6 minutes |
| Dwight: | 11 minutes |
 37.3% incidents where reported in the morning and 62.7% in the evening. The most fires (20.8%) took place on Thursday, and the least (10.3%) on Monday.
 According to the 573 fires from years 2003 - 2018 most fires (13.4%) took place during April, and the least (4.9%) in December.
 Out of all 5,046 cases reported during the years 2003 - 2018, the most belonged to the categories: Overpressure Rupture (57.1%), Rescue & EMS (11.5%), and Fire (11.4%).
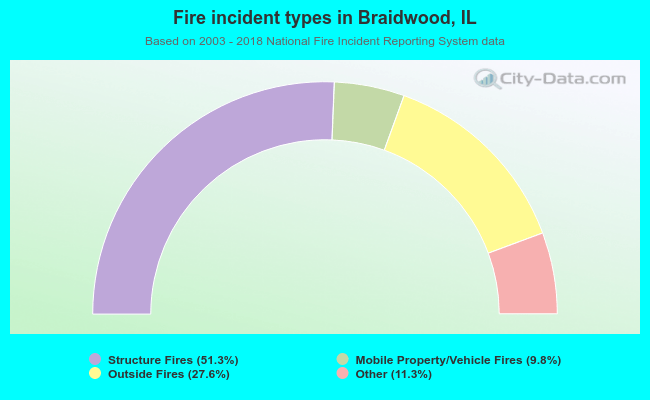 When looking into fire subcategories, the most incidents belonged to: Structure Fires (51.3%), and Outside Fires (27.6%).