Wilmington: Fire Incidents, Illinois (IL)
Where are fire incidents reported in Wilmington, IL
Something went wrong! Please refresh the page.
| Fire incidents reported | |
|---|---|
| Sreet name | Count |
| WATER ST | 96 |
| BALTIMORE ST | 76 |
| LORENZO RD | 58 |
| KANKAKEE ST | 42 |
| STRIPMINE RD | 36 |
| INDIAN TRAIL RD | 32 |
| KANKAKEE RIVER DR | 32 |
| RIVALS RD | 32 |
| KAHLER RD | 30 |
| WIDOWS RD | 30 |
| BALLOU RD | 28 |
| RT 53 | 28 |
| PEOTONE RD | 26 |
| RTE. 53 | 26 |
| COTTAGE RD | 24 |
| OLD CHICAGO RD | 24 |
| WILL RD | 24 |
| ARSENAL RD | 22 |
| COUNTY RD | 22 |
| KELLY RD | 22 |
| RIVER RD | 22 |
| BRIDGE ST | 20 |
| CHICAGO RD | 20 |
| DAVY LN | 20 |
| JOLIET ST | 20 |
| GRAND AVE | 18 |
| MANTENO RD | 18 |
| ROBERTS ST | 18 |
| RT 102 | 18 |
| WATER | 18 |
| Other | 299 |
2002 - 2018 National Fire Incident Reporting System (NFIRS) incidents
- Incident types reported to NFIRS in Wilmington, IL
- 6,07059.8%Rescue & EMS
- 1,20111.8%Fire
- 9759.6%Service Call
- 8458.3%Good Intent Call
- 5845.8%Hazardous Condition
- 4584.5%False Alarm
- 110.1%Special Incident
- Fire incident types reported to NFIRS in Wilmington, IL
- 55546.2%Structure Fires
- 41434.5%Outside Fires
- 15913.2%Mobile Property/Vehicle Fires
- 736.1%Other
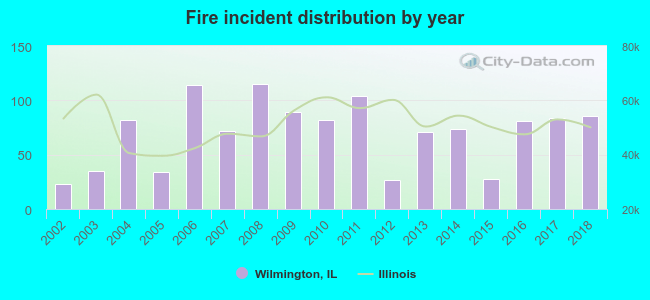 According to the data from the years 2002 - 2018 the average number of fires per year is 71. The highest number of fires - 115 took place in 2008, and the least - 23 in 2002. The data has a rising trend.
The average number of yearly fire incidents per 10k residents in Wilmington, IL compared to nearest cities:
(Note: Based on data for the last 3 years, including only cities with population 5,000 and above)
| Wilmington: | 146.5 |
| Braidwood: | 46.3 |
| Coal City: | 71.2 |
| Channahon: | 43.1 |
| Manhattan: | 60.7 |
| Minooka: | 54.8 |
| Shorewood: | 36.6 |
| Morris: | 101.4 |
| Joliet: | 28.1 |
 The median response time based on all reported fire incidents is 9 minutes. This is higher compared to the state median value.
The median response time in Wilmington, IL compared to nearest cities:
(Note: Based on data for all years, including only cities with at least 500 fire incidents)
| Wilmington: | 9 minutes |
| Braidwood: | 6 minutes |
| Coal City: | 7 minutes |
| Elwood: | 7 minutes |
| Channahon: | 7 minutes |
| Manhattan: | 6 minutes |
| Minooka: | 7 minutes |
| Shorewood: | 5 minutes |
| Morris: | 9 minutes |
 33.4% incidents where reported in the morning and 66.6% in the evening. The most fires (17.2%) took place on Saturday, and the least (12.3%) on Wednesday.
 Based on the 1,201 reports from years 2002 - 2018 most fires (14.8%) took place during April, and the least (6.1%) in September.
 Out of all 10,149 cases reported during the years 2002 - 2018, the most belonged to the categories: Rescue & EMS (59.8%), Fire (11.8%), and Service Call (9.6%).
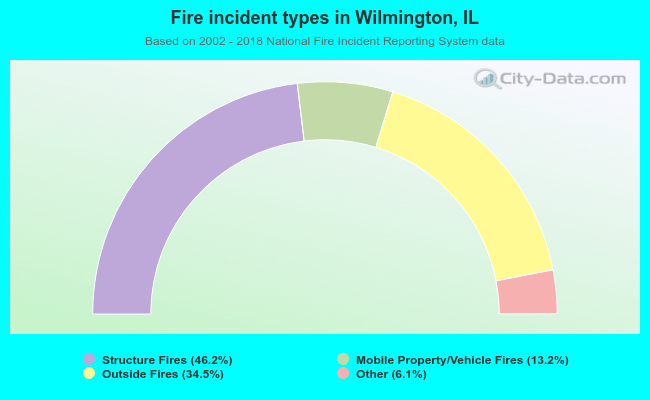 When looking into fire subcategories, the most reports belonged to: Structure Fires (46.2%), and Outside Fires (34.5%).