Delray Beach: Fire Incidents, Florida (FL)
Where are fire incidents reported in Delray Beach, FL
Something went wrong! Please refresh the page.
| Fire incidents reported | |
|---|---|
| Sreet name | Count |
| ATLANTIC AVE | 388 |
| CONGRESS AVE | 190 |
| I95 | 138 |
| LINTON BLVD | 106 |
| SWINTON AVE | 88 |
| FEDERAL HWY | 86 |
| 2ND AVE | 82 |
| 6TH AVE | 82 |
| 3RD AVE | 76 |
| 4TH AVE | 76 |
| FEDERAL HY | 68 |
| LINTON BV | 66 |
| 5TH AVE | 62 |
| LAKE IDA RD | 62 |
| MILITARY TRL | 62 |
| 10TH ST | 60 |
| OCEAN BLVD | 58 |
| 7TH AVE | 54 |
| OCEAN BV | 46 |
| DEPOT AVE | 44 |
| INTERSTATE 95 | 42 |
| 4TH ST | 40 |
| 8TH AVE | 40 |
| 11TH AVE | 36 |
| 1ST AVE | 36 |
| DOTTEREL RD | 36 |
| 10TH AVE | 34 |
| SOUTHRIDGE RD | 34 |
| 1ST ST | 30 |
| 6TH ST | 28 |
2005 - 2018 National Fire Incident Reporting System (NFIRS) incidents
- Incident types reported to NFIRS in Delray Beach, FL
- 45,26773.2%Rescue & EMS
- 5,6789.2%Good Intent Call
- 3,0995.0%False Alarm
- 2,9354.7%Service Call
- 2,5584.1%Hazardous Condition
- 2,2153.6%Fire
- Fire incident types reported to NFIRS in Delray Beach, FL
- 96743.7%Outside Fires
- 66930.2%Structure Fires
- 52123.5%Mobile Property/Vehicle Fires
- 582.6%Other
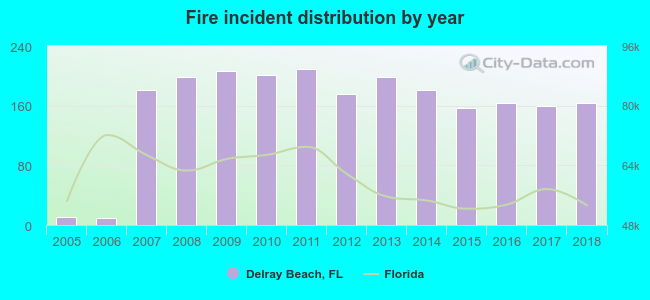 According to the data from the years 2005 - 2018 the average number of fire incidents per year is 158. The highest number of reported fire incidents - 209 took place in 2011, and the least - 9 in 2006. The data has an increasing trend.
The average number of yearly fire incidents per 10k residents in Delray Beach, FL compared to nearest cities:
(Note: Based on data for the last 3 years, including only cities with population 5,000 and above)
| Delray Beach: | 25.0 |
| Boynton Beach: | 15.6 |
| Boca Raton: | 21.4 |
| Lantana: | 26.1 |
| Deerfield Beach: | 20.3 |
| Lake Worth: | 28.6 |
| Greenacres: | 14.3 |
| Palm Springs: | 22.6 |
| Lighthouse Point: | 22.5 |
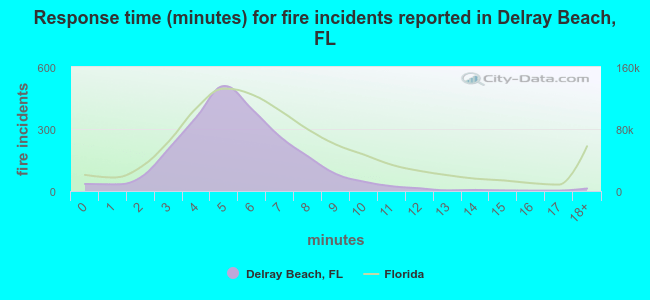 The median response time based on all reported fire incidents is 5 minutes. This is lower compared to the state median value.
The median response time in Delray Beach, FL compared to nearest cities:
(Note: Based on data for all years, including only cities with at least 500 fire incidents)
| Delray Beach: | 5 minutes |
| Boynton Beach: | 5 minutes |
| Boca Raton: | 6 minutes |
| Deerfield Beach: | 6 minutes |
| Lake Worth: | 6 minutes |
| Greenacres: | 5 minutes |
| Coconut Creek: | 6 minutes |
| Pompano Beach: | 6 minutes |
| Margate: | 5 minutes |
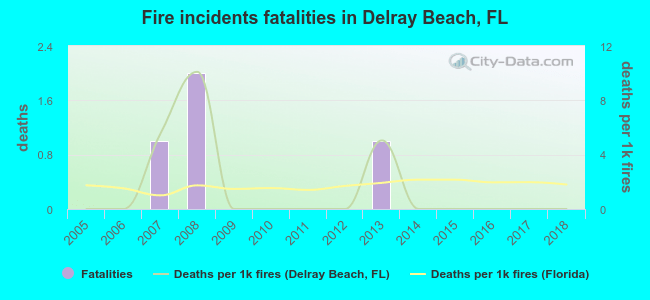 According to the reports from the years 2005 - 2018 the average number of fire-related yearly deaths is 0. The highest number of deaths - 2 took place in 2008, and the lowest - 0 in 2005. The data has a constant trend.
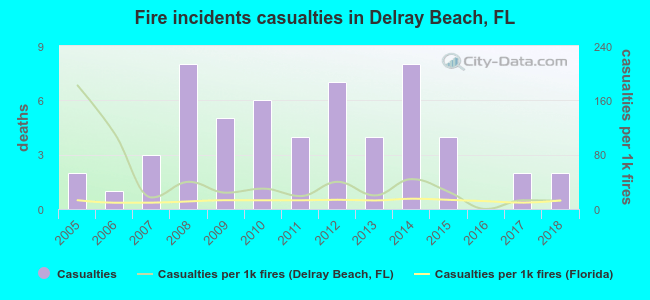 According to the reports from the years 2005 - 2018 the average number of fire-related casualties per year is 4. The highest number of reported casualties - 8 took place in 2008, and the lowest - 0 in 2016. The data has a constant trend.
The average number of casualties per 1,000 fire incidents is 41. This indicator was the highest - 182 in 2005, and the lowest 0 in 2016. The trend for casualties per 1,000 fires is decreasing. Compared to the state value the number of casualties per 1,000 fires is much higher.
According to the reports from the years 2005 - 2018 the average number of fire-related casualties per year is 4. The highest number of reported casualties - 8 took place in 2008, and the lowest - 0 in 2016. The data has a constant trend.
The average number of casualties per 1,000 fire incidents is 41. This indicator was the highest - 182 in 2005, and the lowest 0 in 2016. The trend for casualties per 1,000 fires is decreasing. Compared to the state value the number of casualties per 1,000 fires is much higher.Casualties per 1,000 incidents in Delray Beach, FL compared to nearest cities:
(Note: Based on data for all years, including only cities with at least 500 fire incidents)
| Delray Beach: | 25.3 |
| Boynton Beach: | 17.3 |
| Boca Raton: | 25.2 |
| Deerfield Beach: | 21.5 |
| Lake Worth: | 38.4 |
| Greenacres: | 34.9 |
| Coconut Creek: | 23.3 |
| Pompano Beach: | 41.3 |
| Margate: | 25.8 |
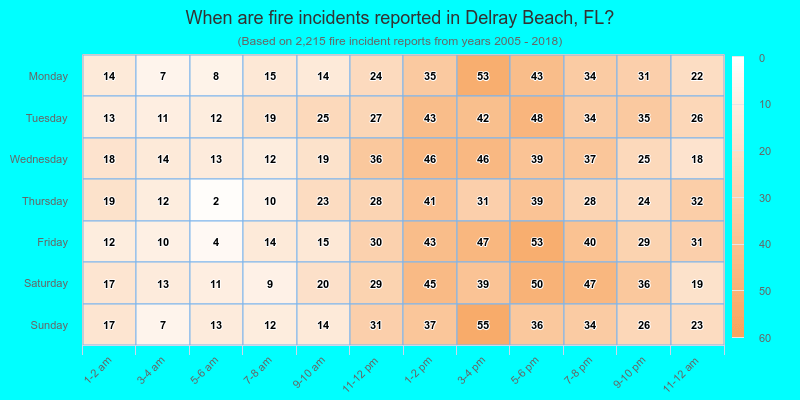
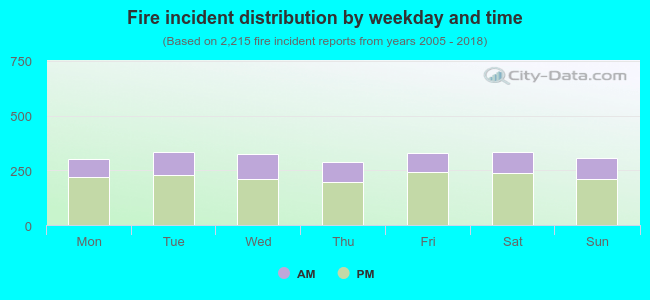 30.4% incidents where reported in the morning and 69.6% in the evening. The most fires (15.1%) took place on Tuesday, and the least (13.0%) on Thursday.
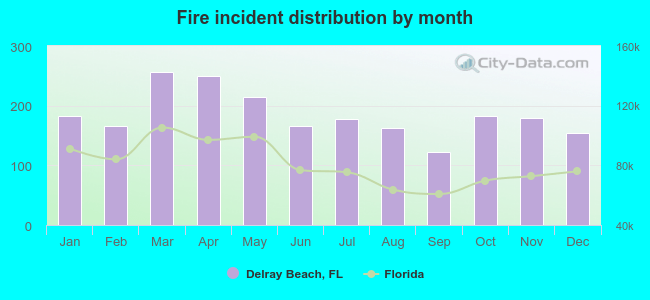 According to the 2,215 fire incidents from years 2005 - 2018 most fires (11.6%) took place during March, and the least (5.5%) in September.
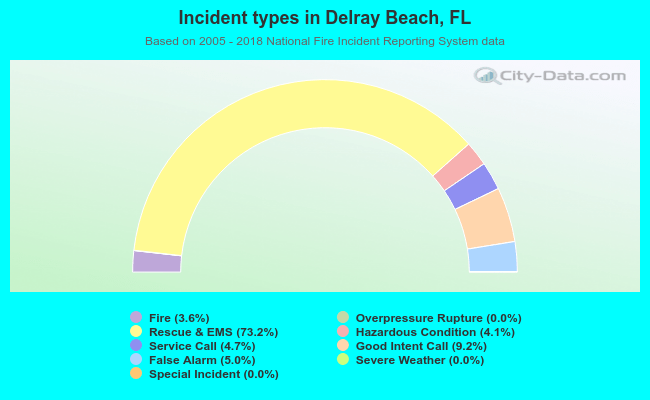 Out of all 61,806 cases reported during the years 2005 - 2018, the most belonged to the categories: Rescue & EMS (73.2%), Good Intent Call (9.2%), and False Alarm (5.0%).
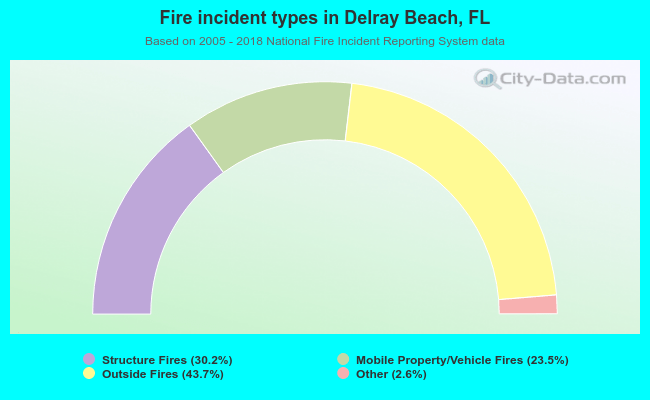 When looking into fire subcategories, the most incidents belonged to: Outside Fires (43.7%), and Structure Fires (30.2%).