| Fire incidents reported |
|---|
| Sreet name | Count |
|---|
| HIGHWAY 69 SOUTH | 40 | | COUNTY ROAD 109 | 24 | | 109 C.R. 133 | 15 | | COUNTY ROAD 8 | 15 | | 6444 CO RD 35 | 10 | | 69 SOUTH | 10 | | 838 COUNTY ROAD 121 | 10 | | 9413 HIWAY 69 S | 10 | | CO. RD. 108 | 10 | | COUNTY ROAD 151 | 10 | | COUNTY ROAD 234 | 10 | | COUNTY ROAD 46 | 10 | | COUNTY ROAD 51 | 10 | | COUNTY ROAD 59 | 10 | | COUNTY ROAD 229 | 9 | | COUNTY ROAD 230 | 9 | | COUNTY ROAD 25 | 9 | | HWY 69 SOUTH | 8 | | 100 CO. RD. 87 | 5 | | 1000 COUNTY ROAD 127 | 5 | | 1031 COUNTY ROAD 46 | 5 | | 109 CO RD 133 | 5 | | 109 COUNTY RD | 5 | | 1119 COUNTY RD 46 | 5 | | 112 COUNTY ROAD228 | 5 |
| | | Fire incidents reported |
|---|
| Sreet name | Count |
|---|
| 1140 COUNTY ROAD 97 | 5 | | 1147 COUNTY ROAD 107 | 5 | | 117 CO RD 106 | 5 | | 1193 COUNTY 18 | 5 | | 1220 CO RD 18 | 5 | | 13000 BLOCK AL HWY 69 SOUTH | 5 | | 134 CO. RD. 65 | 5 | | 134 COUNTY ROAD 65 | 5 | | 1380 COUNTY ROAD 18 | 5 | | 1420 CO RD 54 | 5 | | 1435 CO RD 67 | 5 | | 15014 HIWAY 69 S | 5 | | 15674 AL HWY 69 SOUTH | 5 | | 16596 AL. HWY. 69 SOUTH | 5 | | 1691 AL HWY 91 | 5 | | 1700 COUNTY ROAD 54 | 5 | | 175 CO RD54 | 5 | | 180 CO. RD. 108 | 5 | | 1910 COUNTY ROAD 108 | 5 | | 1921 HWY 91 | 5 | | 1940 CO. RD. 143 | 5 | | 211 CO. RD. 222 | 5 | | 211 COUNTY ROAD 149 | 5 | | 222 | 5 | | |
|
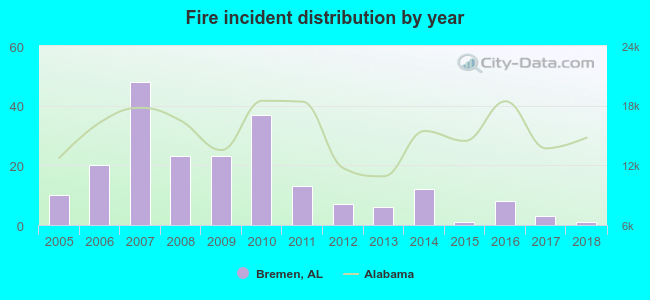 Based on the data from the years 2005 - 2018 the average number of fire incidents per year is 15. The highest number of reported fire incidents - 48 took place in 2007, and the least - 1 in 2015. The data has a declining trend.
 29.2% incidents where reported in the morning and 70.8% in the evening. The most fires (17.0%) took place on Monday, and the least (9.4%) on Wednesday.
 According to the 212 fire incidents from years 2005 - 2018 most fires (12.3%) took place during March, and the least (5.2%) in September.
 Out of all 218 cases reported during the years 2005 - 2018, the most belonged to the categories: Fire (97.2%), Rescue & EMS (1.4%), and Overpressure Rupture (0.9%).
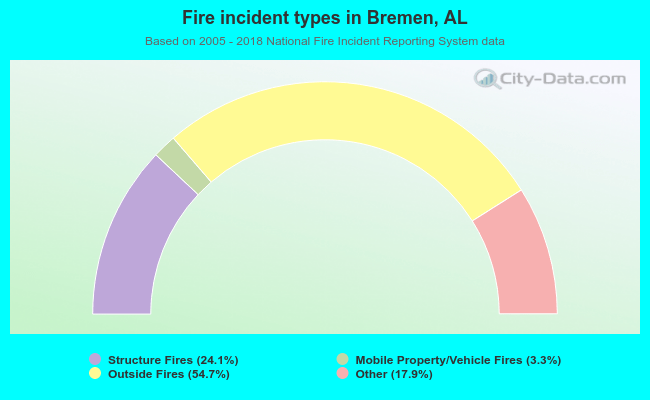 When looking into fire subcategories, the most reports belonged to: Outside Fires (54.7%), and Structure Fires (24.1%).