Buda: Fire Incidents, Texas (TX)
Where are fire incidents reported in Buda, TX
Something went wrong! Please refresh the page.
|
| |||||||||||||||||||||||||||||||||||||||||||||||||||||||||||||||||||||||||||||||||||||||||||||||||||||||||||||
2003 - 2018 National Fire Incident Reporting System (NFIRS) incidents
- Incident types reported to NFIRS in Buda, TX
- 5,34448.0%Rescue & EMS
- 1,38412.4%Hazardous Condition
- 1,37612.4%Good Intent Call
- 1,23911.1%Fire
- 1,14310.3%Service Call
- 6315.7%False Alarm
- Fire incident types reported to NFIRS in Buda, TX
- 68555.3%Outside Fires
- 27222.0%Structure Fires
- 25120.3%Mobile Property/Vehicle Fires
- 312.5%Other
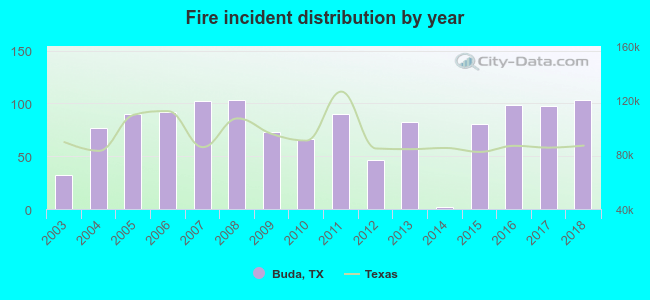 According to the data from the years 2003 - 2018 the average number of fire incidents per year is 77. The highest number of reported fires - 103 took place in 2008, and the least - 2 in 2014. The data has an increasing trend.
The average number of yearly fire incidents per 10k residents in Buda, TX compared to nearest cities:
(Note: Based on data for the last 3 years, including only cities with population 5,000 and above)
| Buda: | 87.3 |
| Kyle: | 50.3 |
| San Marcos: | 45.9 |
| Austin: | 17.6 |
| Bee Cave: | 21.8 |
| Lockhart: | 41.1 |
| Lakeway: | 27.3 |
| Manor: | 38.5 |
| Jollyville: | 0.6 |
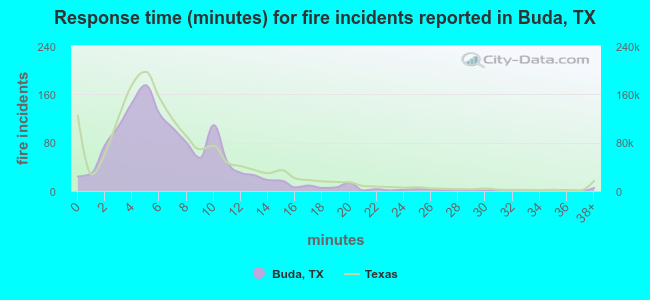 The median response time based on all reported fire incidents is 6 minutes. This is about the same as the state median value.
The median response time in Buda, TX compared to nearest cities:
(Note: Based on data for all years, including only cities with at least 500 fire incidents)
| Buda: | 6 minutes |
| Kyle: | 6 minutes |
| San Marcos: | 6 minutes |
| Austin: | 5 minutes |
| Dripping Springs: | 9 minutes |
| Wimberley: | 11 minutes |
| Lockhart: | 5 minutes |
| Manor: | 8 minutes |
| Pflugerville: | 7 minutes |
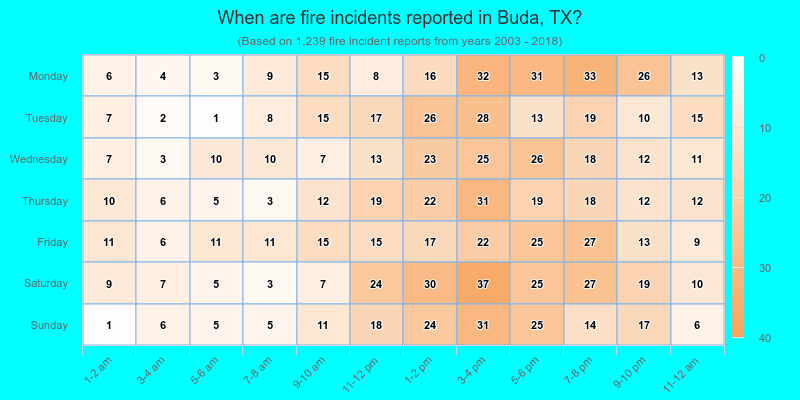
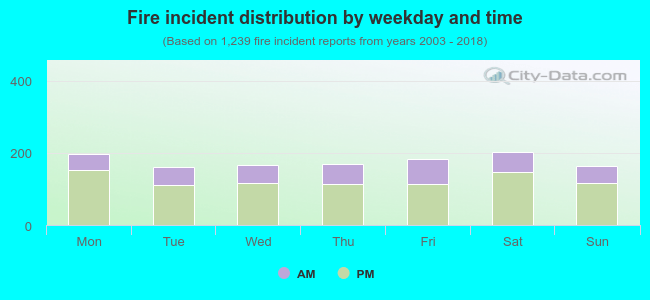 29.9% incidents where reported in the morning and 70.1% in the evening. The most fires (16.4%) took place on Saturday, and the least (13.0%) on Tuesday.
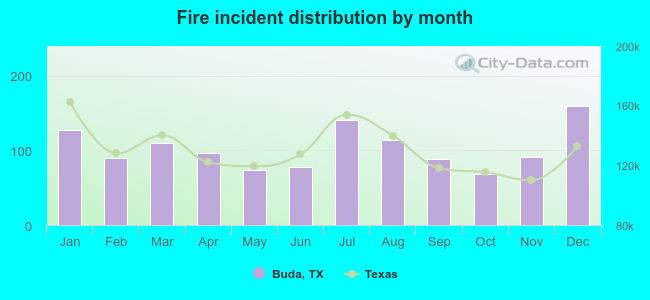 Based on the 1,239 fires from years 2003 - 2018 most fires (12.9%) took place during December, and the least (5.6%) in October.
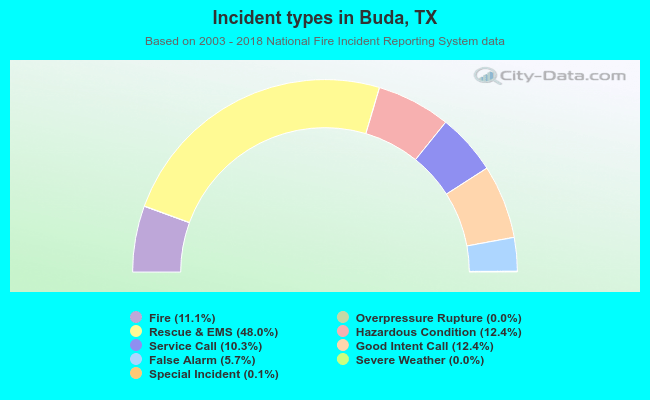 Out of all 11,132 cases reported during the years 2003 - 2018, the most belonged to the categories: Rescue & EMS (48.0%), Hazardous Condition (12.4%), and Good Intent Call (12.4%).
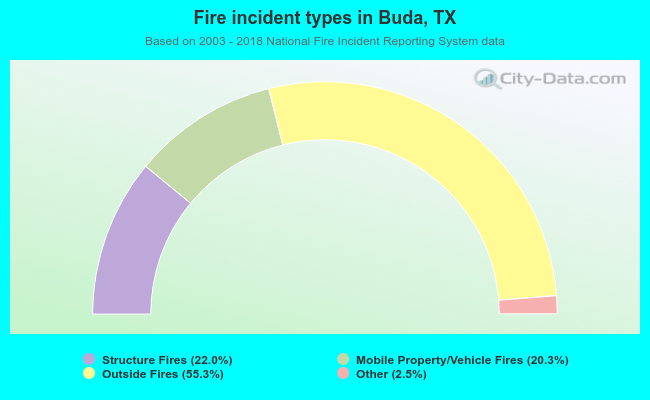 When looking into fire subcategories, the most reports belonged to: Outside Fires (55.3%), and Structure Fires (22.0%).