Lockhart: Fire Incidents, Texas (TX)
Where are fire incidents reported in Lockhart, TX
Something went wrong! Please refresh the page.
| Fire incidents reported | |
|---|---|
| Sreet name | Count |
| COLORADO ST | 212 |
| SAN ANTONIO ST | 60 |
| COMMERCE ST | 46 |
| BLACKJACK ST | 44 |
| HWY 183 | 40 |
| BRAZOS ST | 38 |
| MARKET ST | 38 |
| MAIN ST | 34 |
| PECOS ST | 30 |
| COLORADO | 28 |
| MEDINA ST | 28 |
| GUADALUPE ST | 22 |
| NECHES ST | 22 |
| SILENT VALLEY RD | 22 |
| FLORES ST | 20 |
| FM 1322 | 20 |
| SUMMERSIDE AVE | 20 |
| CHURCH ST | 18 |
| FM 2001 | 18 |
| BLANCO ST | 16 |
| LEGION ST | 16 |
| FM 671 | 14 |
| MONTE VISTA ST | 14 |
| BORCHERT LOOP | 12 |
| PRAIRIE LEA ST | 12 |
| SAN JACINTO ST | 12 |
| SEAWILLOW RD | 12 |
| STATE PARK RD | 12 |
| WICHITA ST | 12 |
| BOIS D ARC ST | 10 |
| Other | 102 |
2002 - 2018 National Fire Incident Reporting System (NFIRS) incidents
- Incident types reported to NFIRS in Lockhart, TX
- 4,94753.6%Rescue & EMS
- 1,39815.1%Hazardous Condition
- 1,00410.9%Fire
- 8118.8%Service Call
- 6517.0%Good Intent Call
- 3964.3%False Alarm
- 130.1%Special Incident
- 120.1%Overpressure Rupture
- Fire incident types reported to NFIRS in Lockhart, TX
- 48648.4%Outside Fires
- 32132.0%Structure Fires
- 15615.5%Mobile Property/Vehicle Fires
- 414.1%Other
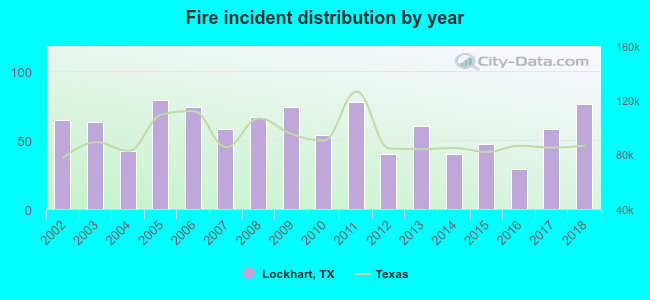 According to the data from the years 2002 - 2018 the average number of fires per year is 59. The highest number of fires - 79 took place in 2005, and the least - 29 in 2016. The data has a rising trend.
The average number of yearly fire incidents per 10k residents in Lockhart, TX compared to nearest cities:
(Note: Based on data for the last 3 years, including only cities with population 5,000 and above)
| Lockhart: | 41.1 |
| Luling: | 121.5 |
| Kyle: | 50.3 |
| San Marcos: | 45.9 |
| Buda: | 87.3 |
| Bastrop: | 180.3 |
| Seguin: | 98.9 |
| Gonzales: | 119.7 |
| Austin: | 17.6 |
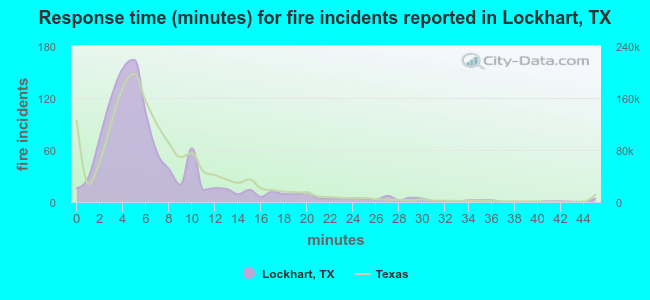 The median response time based on all reported fire incidents is 5 minutes. This is lower compared to the state median value.
The median response time in Lockhart, TX compared to nearest cities:
(Note: Based on data for all years, including only cities with at least 500 fire incidents)
| Lockhart: | 5 minutes |
| Luling: | 8 minutes |
| Kyle: | 6 minutes |
| San Marcos: | 6 minutes |
| Buda: | 6 minutes |
| Wimberley: | 11 minutes |
| Bastrop: | 7 minutes |
| Seguin: | 8 minutes |
| Gonzales: | 9 minutes |
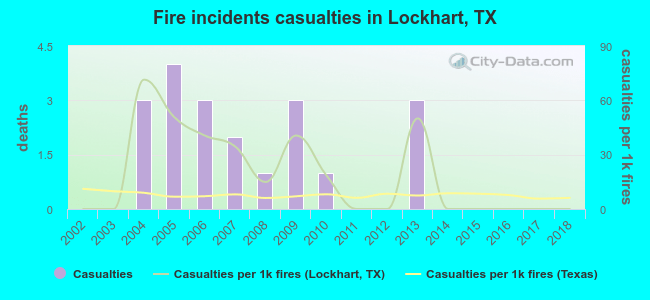 According to the data from the years 2002 - 2018 the average number of fire-related yearly casualties is 1. The highest number of injuries - 4 took place in 2005, and the lowest - 0 in 2002. The data has a constant trend.
The average number of casualties per 1,000 fire incidents is 19. This indicator was the highest - 71 in 2004, and the lowest 0 in 2002. The trend for casualties per 1,000 fire incidents is constant. Compared to the state value the number of casualties per 1,000 fire incidents is much higher.
According to the data from the years 2002 - 2018 the average number of fire-related yearly casualties is 1. The highest number of injuries - 4 took place in 2005, and the lowest - 0 in 2002. The data has a constant trend.
The average number of casualties per 1,000 fire incidents is 19. This indicator was the highest - 71 in 2004, and the lowest 0 in 2002. The trend for casualties per 1,000 fire incidents is constant. Compared to the state value the number of casualties per 1,000 fire incidents is much higher.
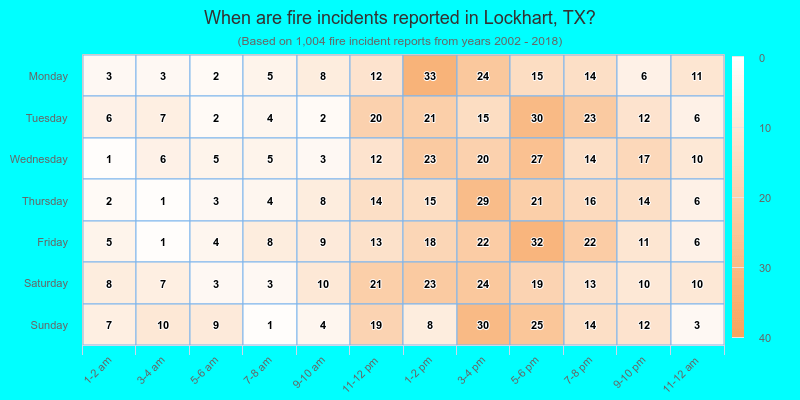
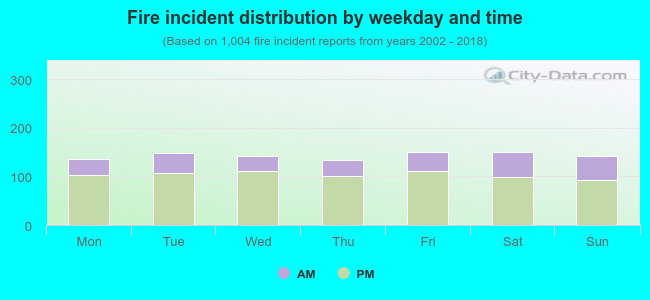 27.9% incidents where reported in the morning and 72.1% in the evening. The most fires (15.0%) took place on Friday, and the least (13.2%) on Thursday.
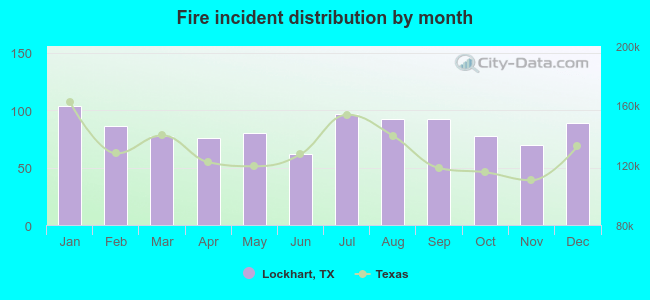 Based on the 1,004 fires from years 2002 - 2018 most fires (10.4%) took place during January, and the least (6.2%) in June.
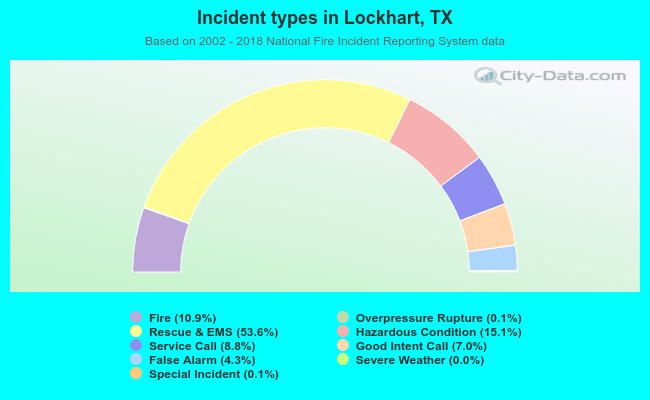 Out of all 9,236 cases reported during the years 2002 - 2018, the most belonged to the categories: Rescue & EMS (53.6%), Hazardous Condition (15.1%), and Fire (10.9%).
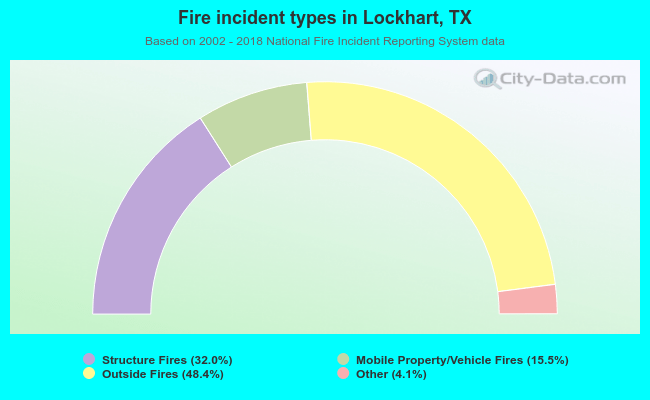 When looking into fire subcategories, the most incidents belonged to: Outside Fires (48.4%), and Structure Fires (32.0%).