Kyle: Fire Incidents, Texas (TX)
Where are fire incidents reported in Kyle, TX
Something went wrong! Please refresh the page.
| Fire incidents reported | |
|---|---|
| Sreet name | Count |
| GOFORTH RD | 122 |
| IH 35 | 116 |
| HIGH RD | 62 |
| COTTON GIN RD | 54 |
| DACY LN | 52 |
| GREEN PASTURES DR | 50 |
| CENTER ST | 48 |
| FM 150 | 42 |
| RR 150 | 38 |
| HWY 21 | 36 |
| IH 35 FR | 36 |
| WINDY HILL RD | 36 |
| CRESTHILL CAUSEWAY | 34 |
| LILAC WAY | 34 |
| SUMMIT DR | 34 |
| BEBEE RD | 30 |
| QUAIL RIDGE DR | 30 |
| CODY LA | 28 |
| CR 158 | 28 |
| IH 35 NB @ 213 MM | 28 |
| PEACEFUL VALLEY RD | 28 |
| CAMINO REAL | 26 |
| FM 1626 | 26 |
| SANTA FE RUN | 26 |
| SKYVIEW TER | 26 |
| JENNIFER DR | 24 |
| LEHMAN RD | 24 |
| MATHIAS LA | 24 |
| QUAIL CV | 22 |
| SHADY OAKS DR | 22 |
| Other | 839 |
2002 - 2018 National Fire Incident Reporting System (NFIRS) incidents
- Incident types reported to NFIRS in Kyle, TX
- 9,30952.2%Rescue & EMS
- 3,24418.2%Good Intent Call
- 2,02511.3%Fire
- 1,2767.2%Service Call
- 1,1656.5%Hazardous Condition
- 7664.3%False Alarm
- 210.1%Severe Weather
- 200.1%Overpressure Rupture
- 190.1%Special Incident
- Fire incident types reported to NFIRS in Kyle, TX
- 1,15056.8%Outside Fires
- 45622.5%Structure Fires
- 33616.6%Mobile Property/Vehicle Fires
- 834.1%Other
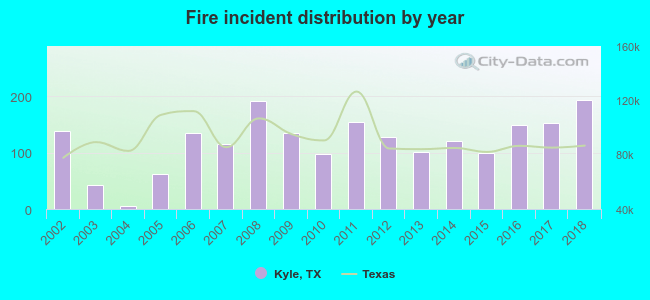 Based on the data from the years 2002 - 2018 the average number of fire incidents per year is 119. The highest number of reported fires - 193 took place in 2018, and the least - 6 in 2004. The data has a rising trend.
The average number of yearly fire incidents per 10k residents in Kyle, TX compared to nearest cities:
(Note: Based on data for the last 3 years, including only cities with population 5,000 and above)
| Kyle: | 50.3 |
| Buda: | 87.3 |
| San Marcos: | 45.9 |
| Lockhart: | 41.1 |
| Bee Cave: | 21.8 |
| Austin: | 17.6 |
| Canyon Lake: | 56.0 |
| New Braunfels: | 35.5 |
| Luling: | 121.5 |
 The median response time based on all reported fire incidents is 6 minutes. This is close to the state median value.
The median response time in Kyle, TX compared to nearest cities:
(Note: Based on data for all years, including only cities with at least 500 fire incidents)
| Kyle: | 6 minutes |
| Buda: | 6 minutes |
| San Marcos: | 6 minutes |
| Wimberley: | 11 minutes |
| Lockhart: | 5 minutes |
| Dripping Springs: | 9 minutes |
| Austin: | 5 minutes |
| Canyon Lake: | 9 minutes |
| New Braunfels: | 7 minutes |
 26.6% incidents where reported in the morning and 73.4% in the evening. The most fires (16.3%) took place on Monday, and the least (12.2%) on Tuesday.
 According to the 2,025 reports from years 2002 - 2018 most fires (12.0%) took place during January, and the least (6.7%) in November.
 Out of all 17,845 cases reported during the years 2002 - 2018, the most belonged to the categories: Rescue & EMS (52.2%), Good Intent Call (18.2%), and Fire (11.3%).
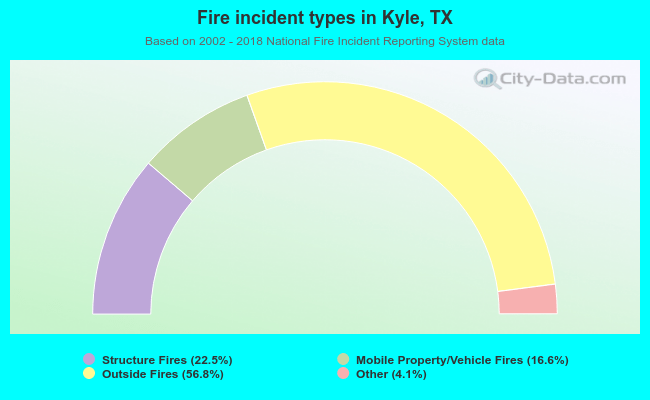 When looking into fire subcategories, the most reports belonged to: Outside Fires (56.8%), and Structure Fires (22.5%).