Burlington: Fire Incidents, Wisconsin (WI)
Where are fire incidents reported in Burlington, WI
Something went wrong! Please refresh the page.
| Fire incidents reported | |
|---|---|
| Sreet name | Count |
| PINE ST | 172 |
| HONEY LAKE RD | 62 |
| MCHENRY ST | 44 |
| BUSHNELL RD | 40 |
| STATE ST | 40 |
| CHESTNUT ST | 36 |
| DURAND AVE | 36 |
| MILWAUKEE AVE | 34 |
| HOOSIER CREEK RD | 32 |
| WHEATLAND RD | 32 |
| KETTERHAGEN RD | 30 |
| MARKET ST | 24 |
| AUTO AID | 22 |
| WATERS EDGE CIR | 20 |
| BROWNS LAKE DR | 18 |
| BYPASSHWY 368311 | 18 |
| CENTER ST | 18 |
| SPRING PRAIRIE RD | 18 |
| TRUMAN CT | 18 |
| WASHINGTON AVE | 18 |
| MABAS CALL | 16 |
| ACADEMY RD | 14 |
| EDGEWOOD DR | 14 |
| PARK ST | 14 |
| SPRING VALLEY RD | 14 |
| JOHNSON ST | 12 |
| MUTUAL AID | 12 |
| PARADISE DR | 12 |
| PLANK RD | 12 |
| WASHINGTON ST | 12 |
| Other | 235 |
2002 - 2018 National Fire Incident Reporting System (NFIRS) incidents
- Incident types reported to NFIRS in Burlington, WI
- 4,07958.6%Rescue & EMS
- 1,09915.8%Fire
- 74610.7%Hazardous Condition
- 4656.7%False Alarm
- 2904.2%Service Call
- 2333.3%Good Intent Call
- 270.4%Severe Weather
- 110.2%Special Incident
- Fire incident types reported to NFIRS in Burlington, WI
- 61956.3%Structure Fires
- 30227.5%Outside Fires
- 999.0%Mobile Property/Vehicle Fires
- 797.2%Other
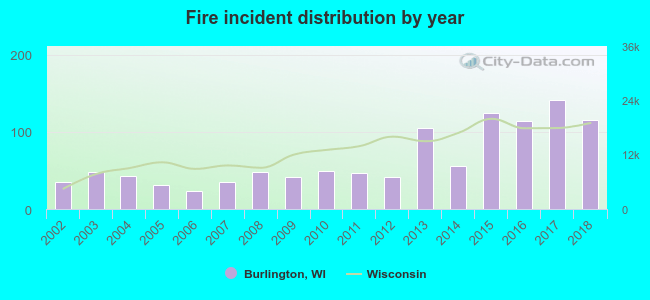 Based on the data from the years 2002 - 2018 the average number of fire incidents per year is 65. The highest number of reported fire incidents - 141 took place in 2017, and the least - 23 in 2006. The data has a growing trend.
The average number of yearly fire incidents per 10k residents in Burlington, WI compared to nearest cities:
(Note: Based on data for the last 3 years, including only cities with population 5,000 and above)
| Burlington: | 117.3 |
| Waterford: | 79.1 |
| Lake Geneva: | 91.7 |
| Bloomfield: | 3.2 |
| Twin Lakes: | 47.0 |
| Tichigan: | 6.8 |
| Wind Lake: | 45.6 |
| Salem: | 27.3 |
| Mukwonago: | 61.4 |
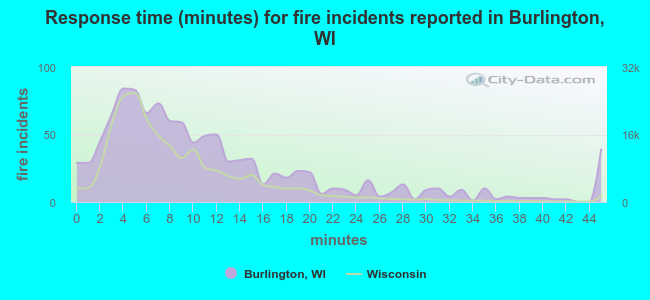 The median response time based on all reported fire incidents is 9 minutes. This is higher than the state median value.
The median response time in Burlington, WI compared to nearest cities:
(Note: Based on data for all years, including only cities with at least 500 fire incidents)
| Burlington: | 9 minutes |
| Lake Geneva: | 8 minutes |
| Union Grove: | 11 minutes |
| Elkhorn: | 6 minutes |
| Richmond: | 6 minutes |
| Spring Grove: | 6 minutes |
| Antioch: | 8 minutes |
| Muskego: | 7 minutes |
| Delavan: | 7 minutes |
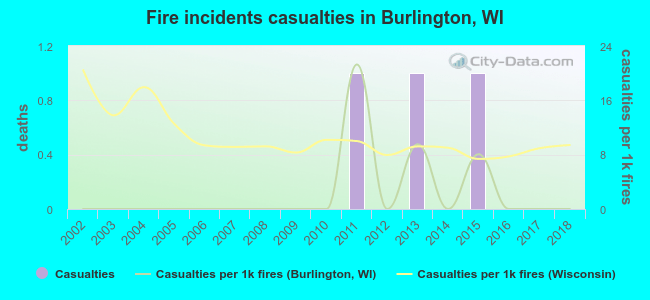 Based on the reports from the years 2002 - 2018 the average number of fire-related casualties per year is 0. The highest number of reported injuries - 1 took place in 2011, and the lowest - 0 in 2002. The data has a constant trend.
The average number of injuries per 1,000 fire incidents is 2. This indicator was the highest - 21 in 2011, and the lowest 0 in 2002. The trend for casualties per 1,000 fire incidents is constant. Compared to the state value the number of casualties per 1,000 fire incidents is much lower.
Based on the reports from the years 2002 - 2018 the average number of fire-related casualties per year is 0. The highest number of reported injuries - 1 took place in 2011, and the lowest - 0 in 2002. The data has a constant trend.
The average number of injuries per 1,000 fire incidents is 2. This indicator was the highest - 21 in 2011, and the lowest 0 in 2002. The trend for casualties per 1,000 fire incidents is constant. Compared to the state value the number of casualties per 1,000 fire incidents is much lower.Casualties per 1,000 incidents in Burlington, WI compared to nearest cities:
(Note: Based on data for all years, including only cities with at least 500 fire incidents)
| Burlington: | 2.7 |
| Lake Geneva: | 3.2 |
| Union Grove: | 5.1 |
| Elkhorn: | 0.0 |
| Richmond: | 7.9 |
| Spring Grove: | 2.5 |
| Antioch: | 7.2 |
| Muskego: | 0.0 |
| Delavan: | 18.6 |
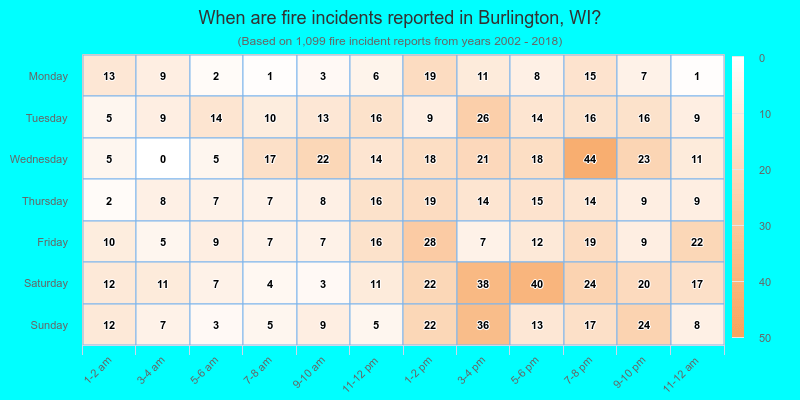
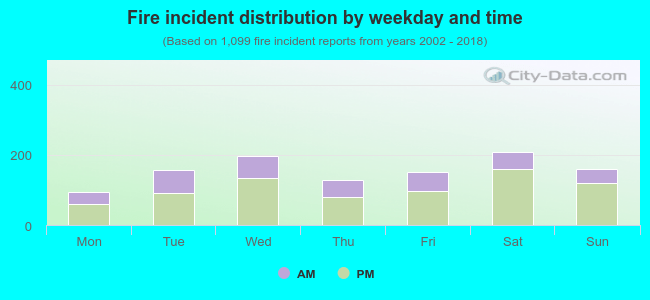 32.3% incidents where reported in the morning and 67.7% in the evening. The most fires (19.0%) took place on Saturday, and the least (8.6%) on Monday.
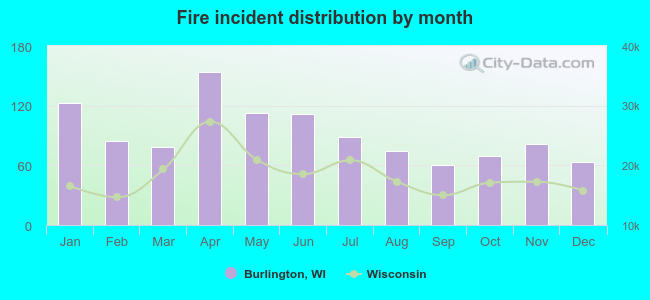 According to the 1,099 reports from years 2002 - 2018 most fires (14.0%) took place during April, and the least (5.5%) in September.
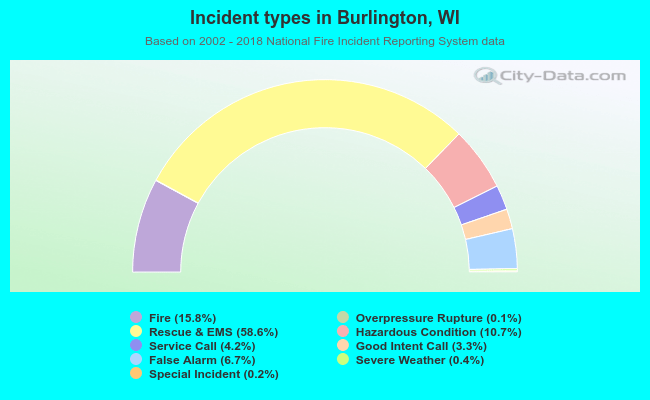 Out of all 6,956 cases reported during the years 2002 - 2018, the most belonged to the categories: Rescue & EMS (58.6%), Fire (15.8%), and Hazardous Condition (10.7%).
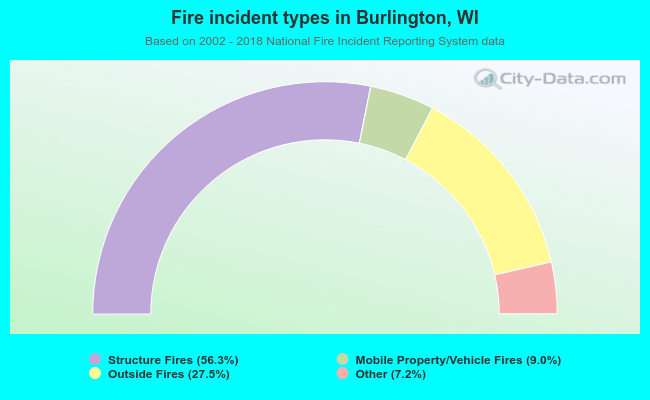 When looking into fire subcategories, the most reports belonged to: Structure Fires (56.3%), and Outside Fires (27.5%).