Muskego: Fire Incidents, Wisconsin (WI)
Where are fire incidents reported in Muskego, WI
Something went wrong! Please refresh the page.
|
| |||||||||||||||||||||||||||||||||||||||||||||||||||||||||||||||||||||||||||||||||||||||||||||||||||||||||||||
| Other | 177 | |||||||||||||||||||||||||||||||||||||||||||||||||||||||||||||||||||||||||||||||||||||||||||||||||||||||||||||
2004 - 2018 National Fire Incident Reporting System (NFIRS) incidents
- Incident types reported to NFIRS in Muskego, WI
- 90237.3%Hazardous Condition
- 61125.3%Fire
- 28912.0%False Alarm
- 27211.2%Rescue & EMS
- 2078.6%Good Intent Call
- 1335.5%Service Call
- 30.1%Severe Weather
- Fire incident types reported to NFIRS in Muskego, WI
- 29247.8%Structure Fires
- 15425.2%Outside Fires
- 8413.7%Other
- 8113.3%Mobile Property/Vehicle Fires
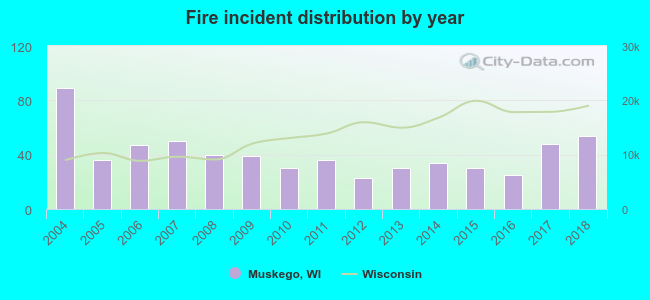 Based on the data from the years 2004 - 2018 the average number of fires per year is 41. The highest number of fires - 89 took place in 2004, and the least - 23 in 2012. The data has a declining trend.
The average number of yearly fire incidents per 10k residents in Muskego, WI compared to nearest cities:
(Note: Based on data for the last 3 years, including only cities with population 5,000 and above)
| Muskego: | 17.2 |
| Hales Corners: | 25.4 |
| New Berlin: | 28.9 |
| Wind Lake: | 45.6 |
| Vernon: | 42.1 |
| Franklin: | 22.7 |
| Tichigan: | 6.8 |
| Greendale: | 17.0 |
| Greenfield: | 14.3 |
 The median response time based on all reported fire incidents is 7 minutes. This is about the same as the Wisconsin median value.
The median response time in Muskego, WI compared to nearest cities:
(Note: Based on data for all years, including only cities with at least 500 fire incidents)
| Muskego: | 7 minutes |
| New Berlin: | 7 minutes |
| Franklin: | 6 minutes |
| Greenfield: | 6 minutes |
| West Allis: | 4 minutes |
| Waukesha: | 6 minutes |
| Brookfield: | 7 minutes |
| Oak Creek: | 6 minutes |
| Wauwatosa: | 6 minutes |
 35.4% incidents where reported in the morning and 64.6% in the evening. The most fires (16.7%) took place on Sunday, and the least (12.3%) on Tuesday.
 Based on the 611 fire incidents from years 2004 - 2018 most fires (12.8%) took place during May, and the least (4.9%) in October.
 Out of all 2,418 cases reported during the years 2004 - 2018, the most belonged to the categories: Rescue & EMS (37.3%), Fire (25.3%), and Good Intent Call (12.0%).
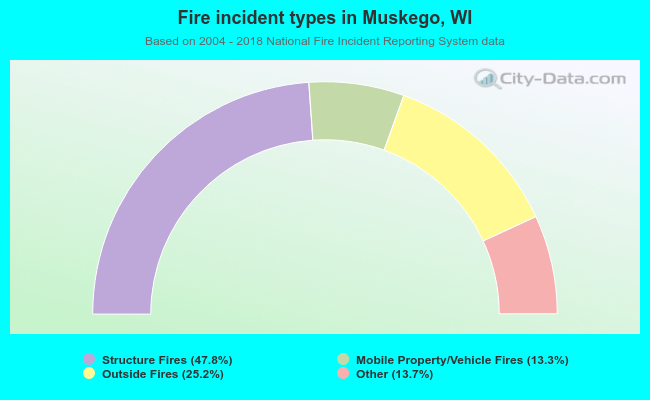 When looking into fire subcategories, the most incidents belonged to: Structure Fires (47.8%), and Outside Fires (25.2%).