Lake Geneva: Fire Incidents, Wisconsin (WI)
Where are fire incidents reported in Lake Geneva, WI
Something went wrong! Please refresh the page.
|
| |||||||||||||||||||||||||||||||||||||||||||||||||||||||||||||||||||||||||||||||||||||||||||||||||||||||||||||
| Other | 169 | |||||||||||||||||||||||||||||||||||||||||||||||||||||||||||||||||||||||||||||||||||||||||||||||||||||||||||||
2003 - 2018 National Fire Incident Reporting System (NFIRS) incidents
- Incident types reported to NFIRS in Lake Geneva, WI
- 4,87761.5%Rescue & EMS
- 99912.6%False Alarm
- 93711.8%Fire
- 7038.9%Hazardous Condition
- 2122.7%Good Intent Call
- 1552.0%Service Call
- 200.3%Special Incident
- 120.2%Severe Weather
- 100.1%Overpressure Rupture
- Fire incident types reported to NFIRS in Lake Geneva, WI
- 47550.7%Structure Fires
- 24426.0%Outside Fires
- 11212.0%Mobile Property/Vehicle Fires
- 10611.3%Other
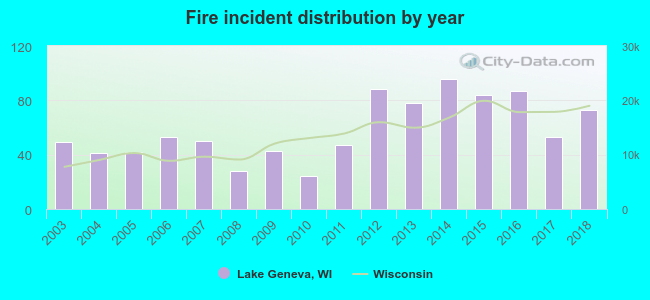 Based on the data from the years 2003 - 2018 the average number of fire incidents per year is 59. The highest number of fires - 96 took place in 2014, and the least - 24 in 2010. The data has an increasing trend.
The average number of yearly fire incidents per 10k residents in Lake Geneva, WI compared to nearest cities:
(Note: Based on data for the last 3 years, including only cities with population 5,000 and above)
| Lake Geneva: | 91.7 |
| Bloomfield: | 3.2 |
| Elkhorn: | 67.2 |
| Burlington: | 117.3 |
| Twin Lakes: | 47.0 |
| Delavan: | 57.2 |
| Salem: | 27.3 |
| Waterford: | 79.1 |
| Mukwonago: | 61.4 |
 The median response time based on all reported fire incidents is 8 minutes. This is about the same as the Wisconsin median value.
The median response time in Lake Geneva, WI compared to nearest cities:
(Note: Based on data for all years, including only cities with at least 500 fire incidents)
| Lake Geneva: | 8 minutes |
| Elkhorn: | 6 minutes |
| Burlington: | 9 minutes |
| Richmond: | 6 minutes |
| Delavan: | 7 minutes |
| Spring Grove: | 6 minutes |
| Harvard: | 9 minutes |
| Wonder Lake: | 7 minutes |
| Fox Lake: | 6 minutes |
 35.4% incidents where reported in the morning and 64.6% in the evening. The most fires (19.6%) took place on Sunday, and the least (10.7%) on Friday.
 According to the 937 fires from years 2003 - 2018 most fires (11.1%) took place during July, and the least (5.3%) in December.
 Out of all 7,925 cases reported during the years 2003 - 2018, the most belonged to the categories: Rescue & EMS (61.5%), False Alarm (12.6%), and Fire (11.8%).
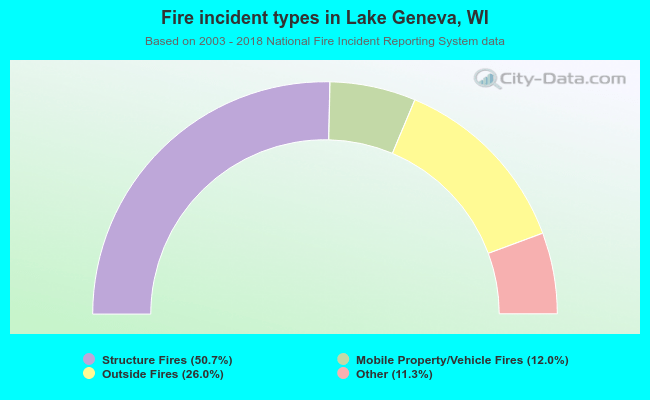 When looking into fire subcategories, the most incidents belonged to: Structure Fires (50.7%), and Outside Fires (26.0%).