New Braunfels: Fire Incidents, Texas (TX)
Where are fire incidents reported in New Braunfels, TX
Something went wrong! Please refresh the page.
| Fire incidents reported | |
|---|---|
| Sreet name | Count |
| IH 35 | 1,564 |
| LOOP 337 | 186 |
| BUSINESS 35 | 172 |
| FM 482 | 154 |
| HWY 46 | 144 |
| FM 725 | 108 |
| FM 306 | 106 |
| WALNUT AVE | 86 |
| HIGHWAY 46 | 78 |
| FM 1101 | 74 |
| FM 1102 | 66 |
| LANDA ST | 66 |
| FM 1863 | 62 |
| GRUENE RD | 62 |
| SEGUIN AVE | 60 |
| FM 1044 | 58 |
| WATSON LN | 56 |
| COMMON ST | 54 |
| FM 758 | 42 |
| OLD HIGHWAY 81 | 42 |
| RIVER RD | 42 |
| WALD ROAD | 42 |
| KLEIN RD | 40 |
| WALD RD | 40 |
| LAKESIDE PASS | 36 |
| SAN ANTONIO ST | 36 |
| STATE HWY 46 | 36 |
| FM 2722 | 34 |
| MILL ST | 28 |
| SAN ANTONIO STREET | 28 |
| Other | 860 |
2003 - 2018 National Fire Incident Reporting System (NFIRS) incidents
- Incident types reported to NFIRS in New Braunfels, TX
- 33,77367.8%Rescue & EMS
- 4,4629.0%Fire
- 3,4186.9%False Alarm
- 2,7455.5%Service Call
- 2,6775.4%Good Intent Call
- 2,5855.2%Hazardous Condition
- 570.1%Special Incident
- 510.1%Overpressure Rupture
- Fire incident types reported to NFIRS in New Braunfels, TX
- 2,38153.4%Outside Fires
- 1,19526.8%Structure Fires
- 84018.8%Mobile Property/Vehicle Fires
- 461.0%Other
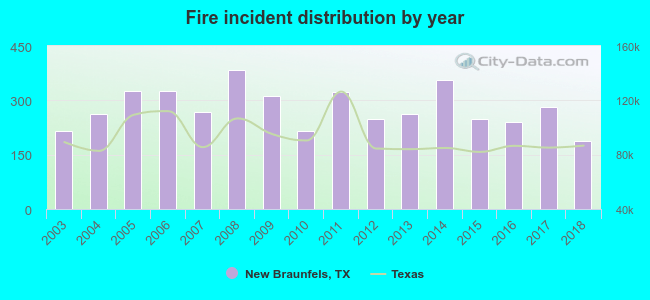 Based on the data from the years 2003 - 2018 the average number of fires per year is 278. The highest number of fires - 383 took place in 2008, and the least - 188 in 2018. The data has a dropping trend.
The average number of yearly fire incidents per 10k residents in New Braunfels, TX compared to nearest cities:
(Note: Based on data for the last 3 years, including only cities with population 5,000 and above)
| New Braunfels: | 35.5 |
| Cibolo: | 29.5 |
| Schertz: | 32.5 |
| Seguin: | 98.9 |
| Selma: | 31.4 |
| Universal City: | 28.7 |
| Canyon Lake: | 56.0 |
| San Marcos: | 45.9 |
| Live Oak: | 4.0 |
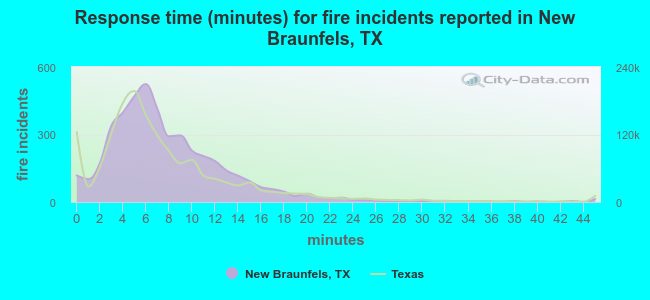 The median response time based on all reported fire incidents is 7 minutes. This is comparable to the state median value.
The median response time in New Braunfels, TX compared to nearest cities:
(Note: Based on data for all years, including only cities with at least 500 fire incidents)
| New Braunfels: | 7 minutes |
| Cibolo: | 8 minutes |
| Schertz: | 7 minutes |
| Seguin: | 8 minutes |
| Universal City: | 5 minutes |
| Canyon Lake: | 9 minutes |
| San Marcos: | 6 minutes |
| Converse: | 6 minutes |
| Bulverde: | 9 minutes |
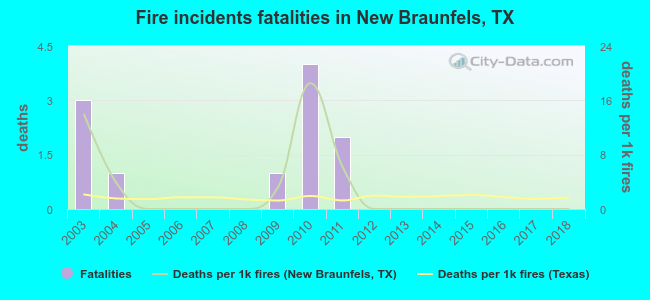 Based on the data from the years 2003 - 2018 the average number of fire-related fatalities per year is 1. The highest number of deaths - 4 took place in 2010, and the lowest - 0 in 2005. The data has a declining trend.
The average number of deaths per 1,000 fire incidents is 3. This indicator was the highest - 19 in 2010, and the lowest 0 in 2005. The trend for deaths per 1,000 fire incidents is decreasing. Compared to the Texas value the number of fatalities per 1,000 fire incidents is higher.
Based on the data from the years 2003 - 2018 the average number of fire-related fatalities per year is 1. The highest number of deaths - 4 took place in 2010, and the lowest - 0 in 2005. The data has a declining trend.
The average number of deaths per 1,000 fire incidents is 3. This indicator was the highest - 19 in 2010, and the lowest 0 in 2005. The trend for deaths per 1,000 fire incidents is decreasing. Compared to the Texas value the number of fatalities per 1,000 fire incidents is higher.Deaths per 1,000 incidents in New Braunfels, TX compared to nearest cities:
(Note: Based on data for all years, including only cities with at least 2,500 fire incidents)
| New Braunfels: | 2.5 |
| Seguin: | 1.6 |
| San Marcos: | 1.1 |
| San Antonio: | 1.1 |
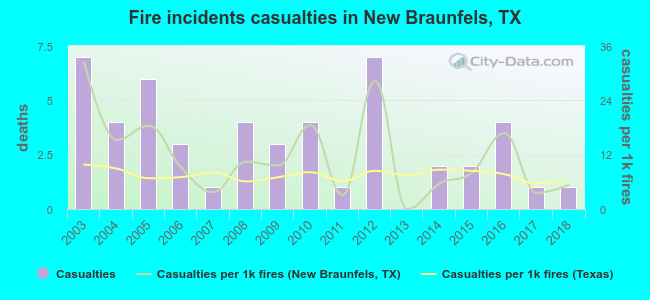 Based on the reports from the years 2003 - 2018 the average number of fire-related yearly casualties is 3. The highest number of injuries - 7 took place in 2003, and the lowest - 0 in 2013. The data has a decreasing trend.
The average number of injuries per 1,000 fire incidents is 12. This indicator was the highest - 32 in 2003, and the lowest 0 in 2013. The trend for casualties per 1,000 incidents is declining. Compared to the Texas value the number of injuries per 1,000 fires is higher.
Based on the reports from the years 2003 - 2018 the average number of fire-related yearly casualties is 3. The highest number of injuries - 7 took place in 2003, and the lowest - 0 in 2013. The data has a decreasing trend.
The average number of injuries per 1,000 fire incidents is 12. This indicator was the highest - 32 in 2003, and the lowest 0 in 2013. The trend for casualties per 1,000 incidents is declining. Compared to the Texas value the number of injuries per 1,000 fires is higher.Casualties per 1,000 incidents in New Braunfels, TX compared to nearest cities:
(Note: Based on data for all years, including only cities with at least 500 fire incidents)
| New Braunfels: | 11.2 |
| Cibolo: | 5.2 |
| Schertz: | 7.5 |
| Seguin: | 11.7 |
| Universal City: | 23.8 |
| Canyon Lake: | 2.2 |
| San Marcos: | 5.7 |
| Converse: | 5.6 |
| Bulverde: | 0.0 |
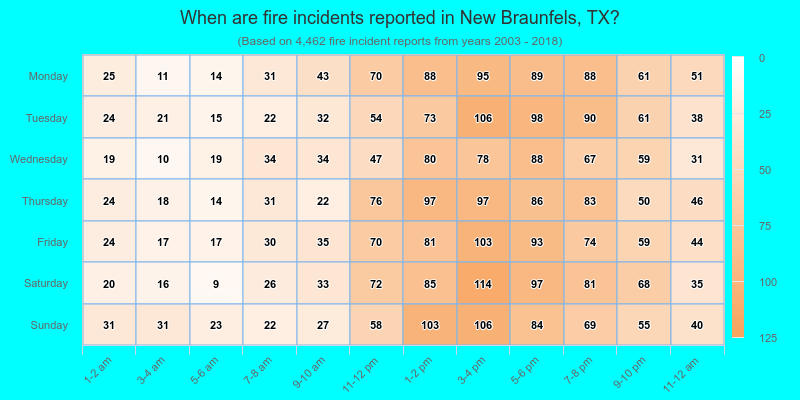
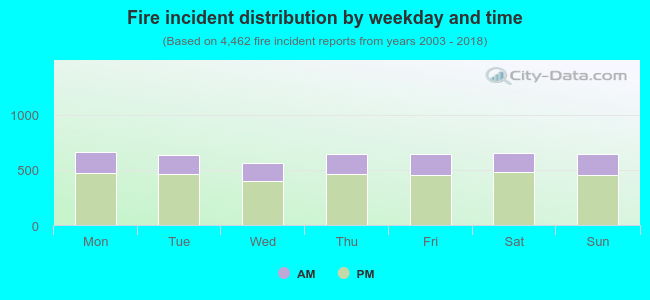 28.5% incidents where reported in the morning and 71.5% in the evening. The most fires (14.9%) took place on Monday, and the least (12.7%) on Wednesday.
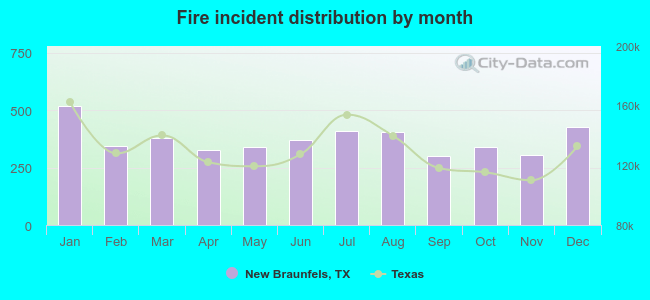 According to the 4,462 fire incident reports from years 2003 - 2018 most fires (11.6%) took place during January, and the least (6.8%) in September.
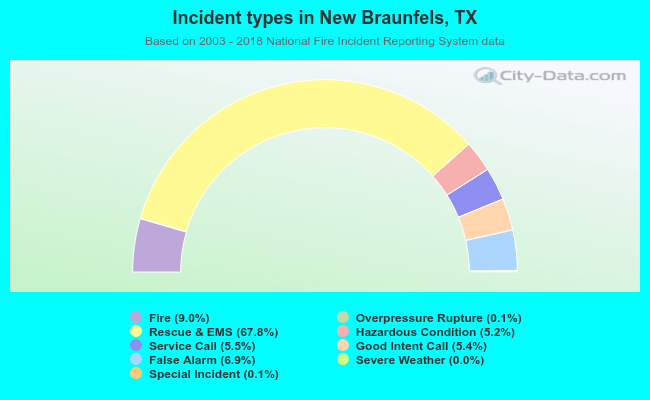 Out of all 49,784 cases reported during the years 2003 - 2018, the most belonged to the categories: Rescue & EMS (67.8%), Fire (9.0%), and False Alarm (6.9%).
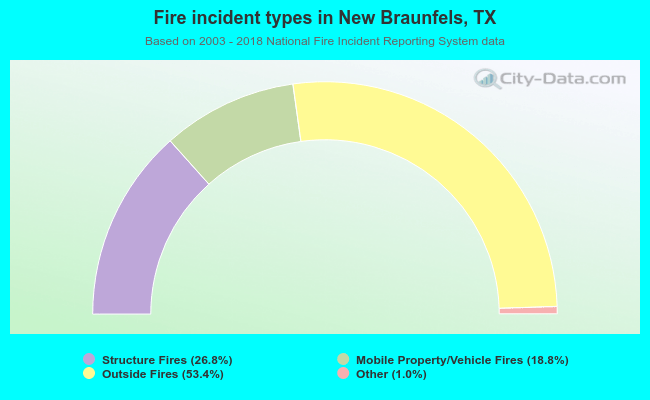 When looking into fire subcategories, the most incidents belonged to: Outside Fires (53.4%), and Structure Fires (26.8%).