Bartlett: Fire Incidents, Illinois (IL)
Where are fire incidents reported in Bartlett, IL
Something went wrong! Please refresh the page.
| Fire incidents reported | |
|---|---|
| Sreet name | Count |
| BARTLETT RD | 100 |
| STEARNS RD | 76 |
| LAKE ST | 66 |
| IL 59 | 62 |
| ROUTE 59 | 38 |
| RT 59 | 38 |
| HARBOR TER | 32 |
| ARMY TRAIL RD | 30 |
| MUNGER RD | 26 |
| DEERE PARK CIR | 24 |
| SPAULDING RD | 24 |
| WESTRIDGE BLVD | 24 |
| DEVON AVE | 22 |
| GEORGIAN PL | 22 |
| SCHICK RD | 22 |
| NAPERVILLE RD | 20 |
| POWIS RD | 20 |
| SYCAMORE LN | 20 |
| LONGFORD RD | 18 |
| BUCKINGHAM DR | 16 |
| CHELMSFORD CT | 16 |
| LITCHFIELD LN | 16 |
| AMHERST DR | 14 |
| BARTLETT | 14 |
| CAPISTRANO TER | 14 |
| HILL CT | 14 |
| INDEPENDENCE DR | 14 |
| NORTH AVE | 14 |
| OAK AVE | 14 |
| SAYER RD | 14 |
| Other | 447 |
2002 - 2018 National Fire Incident Reporting System (NFIRS) incidents
- Incident types reported to NFIRS in Bartlett, IL
- 10,52063.1%Rescue & EMS
- 1,6079.6%Hazardous Condition
- 1,4428.7%False Alarm
- 1,2917.7%Fire
- 1,0546.3%Service Call
- 7134.3%Good Intent Call
- Fire incident types reported to NFIRS in Bartlett, IL
- 62148.1%Structure Fires
- 48237.3%Outside Fires
- 1269.8%Mobile Property/Vehicle Fires
- 624.8%Other
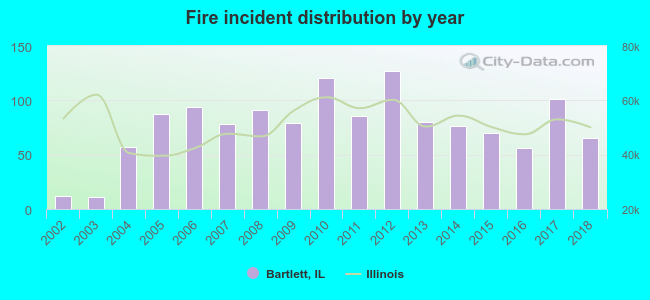 According to the data from the years 2002 - 2018 the average number of fire incidents per year is 76. The highest number of reported fire incidents - 127 took place in 2012, and the least - 11 in 2003. The data has an increasing trend.
The average number of yearly fire incidents per 10k residents in Bartlett, IL compared to nearest cities:
(Note: Based on data for the last 3 years, including only cities with population 5,000 and above)
| Bartlett: | 17.8 |
| Hanover Park: | 24.4 |
| Streamwood: | 21.8 |
| Carol Stream: | 21.1 |
| Roselle: | 37.8 |
| South Elgin: | 28.5 |
| Bloomingdale: | 34.5 |
| West Chicago: | 40.1 |
| Elgin: | 28.3 |
 The median response time based on all reported fire incidents is 5 minutes. This is comparable to the state median value.
The median response time in Bartlett, IL compared to nearest cities:
(Note: Based on data for all years, including only cities with at least 500 fire incidents)
| Bartlett: | 5 minutes |
| Hanover Park: | 4 minutes |
| Streamwood: | 5 minutes |
| Carol Stream: | 5 minutes |
| Roselle: | 6 minutes |
| South Elgin: | 5 minutes |
| Bloomingdale: | 5 minutes |
| West Chicago: | 6 minutes |
| Elgin: | 4 minutes |
 According to the data from the years 2002 - 2018 the average number of fire-related yearly casualties is 1. The highest number of injuries - 4 took place in 2005, and the lowest - 0 in 2002. The data has a constant trend.
The average number of casualties per 1,000 fires is 11. This indicator was the highest - 54 in 2016, and the lowest 0 in 2002. The trend for injuries per 1,000 incidents is constant. Compared to the Illinois value the number of injuries per 1,000 fire incidents is about the same.
According to the data from the years 2002 - 2018 the average number of fire-related yearly casualties is 1. The highest number of injuries - 4 took place in 2005, and the lowest - 0 in 2002. The data has a constant trend.
The average number of casualties per 1,000 fires is 11. This indicator was the highest - 54 in 2016, and the lowest 0 in 2002. The trend for injuries per 1,000 incidents is constant. Compared to the Illinois value the number of injuries per 1,000 fire incidents is about the same.Casualties per 1,000 incidents in Bartlett, IL compared to nearest cities:
(Note: Based on data for all years, including only cities with at least 500 fire incidents)
| Bartlett: | 11.6 |
| Hanover Park: | 36.5 |
| Streamwood: | 15.0 |
| Carol Stream: | 7.4 |
| Roselle: | 12.6 |
| South Elgin: | 10.9 |
| Bloomingdale: | 12.1 |
| West Chicago: | 20.6 |
| Elgin: | 25.6 |
 29.7% incidents where reported in the morning and 70.3% in the evening. The most fires (17.8%) took place on Sunday, and the least (10.8%) on Wednesday.
 According to the 1,291 reports from years 2002 - 2018 most fires (12.3%) took place during April, and the least (4.1%) in December.
 Out of all 16,660 cases reported during the years 2002 - 2018, the most belonged to the categories: Rescue & EMS (63.1%), Hazardous Condition (9.6%), and False Alarm (8.7%).
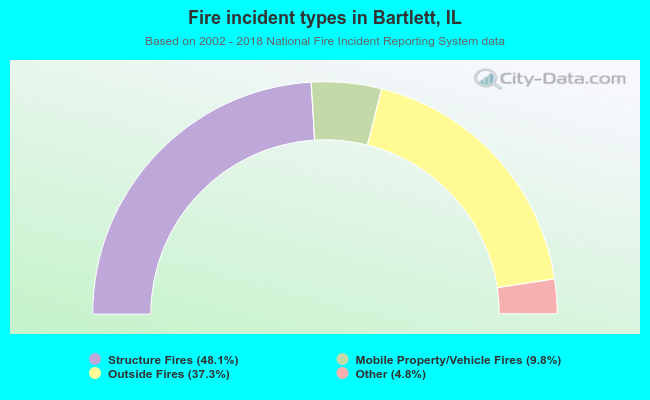 When looking into fire subcategories, the most incidents belonged to: Structure Fires (48.1%), and Outside Fires (37.3%).