Carthage: Fire Incidents, Missouri (MO)
Where are fire incidents reported in Carthage, MO
Something went wrong! Please refresh the page.
| Fire incidents reported | |
|---|---|
| Sreet name | Count |
| MAIN ST | 84 |
| GARRISON AVE | 74 |
| OAK ST | 70 |
| OLD 66 BLVD | 70 |
| FIR RD | 68 |
| GRAND AVE | 68 |
| GUM RD | 64 |
| ELM RD | 56 |
| BAKER BLVD | 54 |
| COUNTY ROAD 110 | 54 |
| FAIRVIEW AVE | 54 |
| COUNTY ROAD 130 | 50 |
| COUNTY ROAD 100 | 46 |
| COUNTY ROAD 120 | 46 |
| CHESTNUT ST | 44 |
| HAZEL ST | 42 |
| STATE HIGHWAY 96 | 42 |
| CHAPEL RD | 38 |
| CENTRAL AVE | 36 |
| KAFIR RD | 36 |
| OLIVE ST | 36 |
| ORNER ST | 36 |
| RIVER ST | 36 |
| APPLE RD | 34 |
| CLINTON ST | 34 |
| COUNTY ROAD 160 | 34 |
| COUNTY ROAD 90 | 34 |
| IVY RD | 34 |
| VALLEY ST | 34 |
| CENTRAL | 30 |
| Other | 962 |
2003 - 2018 National Fire Incident Reporting System (NFIRS) incidents
- Incident types reported to NFIRS in Carthage, MO
- 4,78047.5%Rescue & EMS
- 2,40023.9%Fire
- 9569.5%Good Intent Call
- 8628.6%Service Call
- 6666.6%Hazardous Condition
- 3393.4%False Alarm
- 320.3%Special Incident
- 140.1%Overpressure Rupture
- Fire incident types reported to NFIRS in Carthage, MO
- 1,22250.9%Outside Fires
- 84635.3%Structure Fires
- 29912.5%Mobile Property/Vehicle Fires
- 331.4%Other
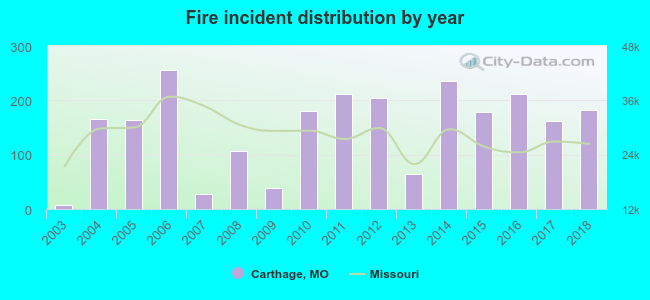 According to the data from the years 2003 - 2018 the average number of fires per year is 150. The highest number of reported fire incidents - 256 took place in 2006, and the least - 8 in 2003. The data has a growing trend.
The average number of yearly fire incidents per 10k residents in Carthage, MO compared to nearest cities:
(Note: Based on data for the last 3 years, including only cities with population 5,000 and above)
| Carthage: | 130.1 |
| Webb City: | 99.0 |
| Joplin: | 74.0 |
| Carl Junction: | 5.7 |
| Neosho: | 109.3 |
| Monett: | 31.7 |
 The median response time based on all reported fire incidents is 7 minutes. This is comparable to the state median value.
The median response time in Carthage, MO compared to nearest cities:
(Note: Based on data for all years, including only cities with at least 500 fire incidents)
| Carthage: | 7 minutes |
| Webb City: | 5 minutes |
| Joplin: | 6 minutes |
| Galena: | 5 minutes |
| Neosho: | 7 minutes |
| Lamar: | 5 minutes |
| Baxter Springs: | 7 minutes |
| Pittsburg: | 3 minutes |
| Monett: | 6 minutes |
 27.1% incidents where reported in the morning and 72.9% in the evening. The most fires (16.5%) took place on Saturday, and the least (12.5%) on Thursday.
 Based on the 2,400 incident reports from years 2003 - 2018 most fires (12.7%) took place during March, and the least (5.5%) in September.
 Out of all 10,053 cases reported during the years 2003 - 2018, the most belonged to the categories: Rescue & EMS (47.5%), Fire (23.9%), and Good Intent Call (9.5%).
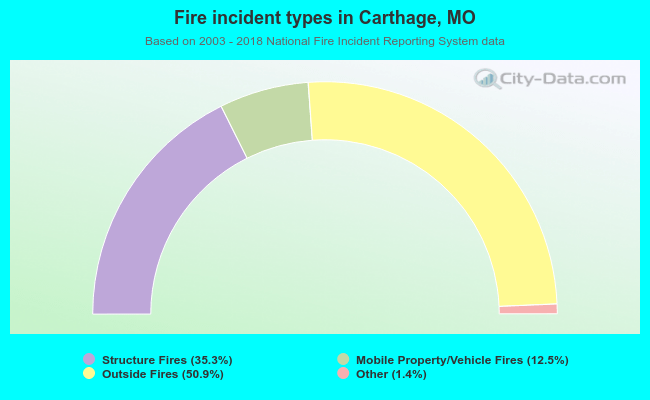 When looking into fire subcategories, the most reports belonged to: Outside Fires (50.9%), and Structure Fires (35.3%).