Casselberry: Fire Incidents, Florida (FL)
Where are fire incidents reported in Casselberry, FL
Something went wrong! Please refresh the page.
| Fire incidents reported | |
|---|---|
| Sreet name | Count |
| SR 436 | 290 |
| SUNSHADOW DR | 52 |
| SEMINOLA BLVD | 46 |
| WINTER PARK DR | 38 |
| SEMINOLA BLVD | 34 |
| N WINTER PARK DR | 30 |
| US HWY 1792 | 28 |
| PARK DR | 26 |
| CASTLE WOOD TER | 24 |
| LAKE DR | 24 |
| TRIPLET LAKE DR | 24 |
| RED BUG LAKE RD | 22 |
| CARLISLE DR | 20 |
| GEORGETOWN DR | 18 |
| S US 17 92 | 18 |
| BRIDLE PATH | 16 |
| CASTLE WOOD | 16 |
| CRYSTAL BOWL CIR | 16 |
| SAN JOSE CIR | 16 |
| SANDPIPER LN | 16 |
| SUNCREST LOOP | 16 |
| WILSHIRE DR | 16 |
| BAYOU DR | 14 |
| CARLISLE DR | 14 |
| CONCH SHELL LN | 14 |
| KENWICK CIR | 14 |
| OSCEOLA TRL | 14 |
| REFLECTIONS CIR | 14 |
| SUNCREST LOOP | 14 |
| US 1792 | 14 |
| Other | 554 |
2003 - 2017 National Fire Incident Reporting System (NFIRS) incidents
- Incident types reported to NFIRS in Casselberry, FL
- 13,01062.0%Rescue & EMS
- 2,0479.8%Hazardous Condition
- 1,8959.0%Good Intent Call
- 1,6227.7%Service Call
- 1,4727.0%Fire
- 9154.4%False Alarm
- Fire incident types reported to NFIRS in Casselberry, FL
- 65644.6%Outside Fires
- 54437.0%Structure Fires
- 21314.5%Mobile Property/Vehicle Fires
- 594.0%Other
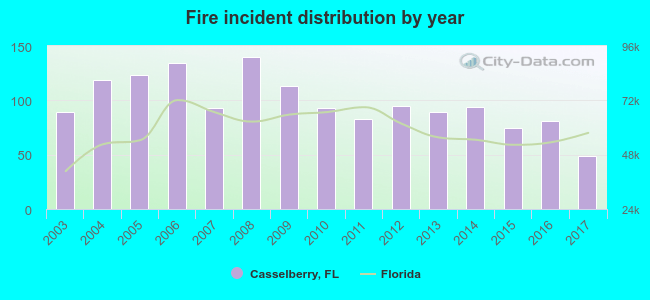 According to the data from the years 2003 - 2017 the average number of fire incidents per year is 98. The highest number of fire incidents - 140 took place in 2008, and the least - 49 in 2017. The data has a decreasing trend.
The average number of yearly fire incidents per 10k residents in Casselberry, FL compared to nearest cities:
(Note: Based on data for the last 3 years, including only cities with population 5,000 and above)
| Casselberry: | 16.5 |
| Fern Park: | 13.8 |
| Longwood: | 38.7 |
| Maitland: | 21.6 |
| Winter Springs: | 11.3 |
| Altamonte Springs: | 16.7 |
| Winter Park: | 32.9 |
| Lake Mary: | 18.4 |
| Oviedo: | 19.3 |
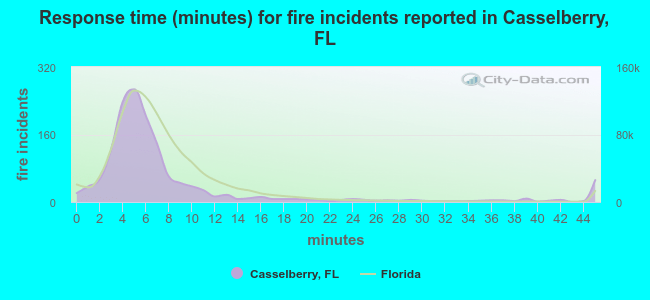 The median response time based on all reported fire incidents is 5 minutes. This is lower than the state median value.
The median response time in Casselberry, FL compared to nearest cities:
(Note: Based on data for all years, including only cities with at least 500 fire incidents)
| Casselberry: | 5 minutes |
| Longwood: | 5 minutes |
| Maitland: | 5 minutes |
| Winter Springs: | 5 minutes |
| Altamonte Springs: | 5 minutes |
| Winter Park: | 6 minutes |
| Lake Mary: | 6 minutes |
| Oviedo: | 6 minutes |
| Orlando: | 7 minutes |
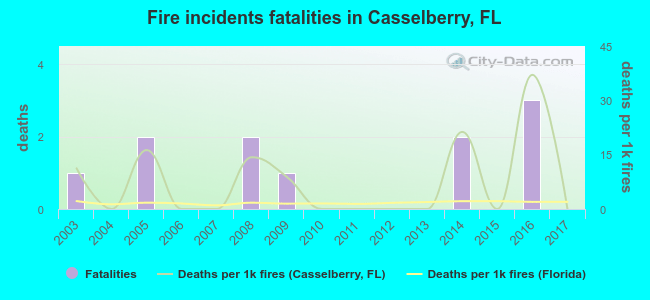 According to the data from the years 2003 - 2017 the average number of fire-related yearly deaths is 1. The highest number of deaths - 3 took place in 2016, and the lowest - 0 in 2004. The data has a declining trend.
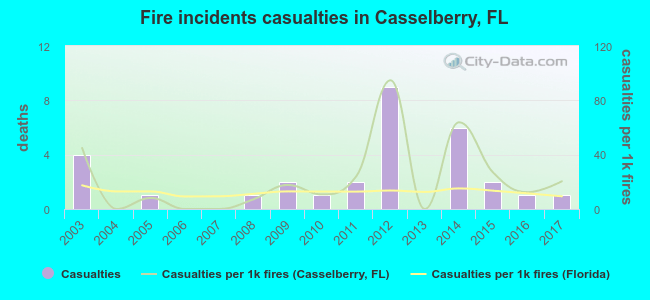 Based on the data from the years 2003 - 2017 the average number of fire-related casualties per year is 2. The highest number of reported injuries - 9 took place in 2012, and the lowest - 0 in 2004. The data has a decreasing trend.
The average number of injuries per 1,000 fires is 22. This indicator was the highest - 95 in 2012, and the lowest 0 in 2004. The trend for casualties per 1,000 fires is decreasing. Compared to the state value the number of injuries per 1,000 incidents is higher.
Based on the data from the years 2003 - 2017 the average number of fire-related casualties per year is 2. The highest number of reported injuries - 9 took place in 2012, and the lowest - 0 in 2004. The data has a decreasing trend.
The average number of injuries per 1,000 fires is 22. This indicator was the highest - 95 in 2012, and the lowest 0 in 2004. The trend for casualties per 1,000 fires is decreasing. Compared to the state value the number of injuries per 1,000 incidents is higher.Casualties per 1,000 incidents in Casselberry, FL compared to nearest cities:
(Note: Based on data for all years, including only cities with at least 500 fire incidents)
| Casselberry: | 20.4 |
| Longwood: | 29.7 |
| Maitland: | 14.0 |
| Winter Springs: | 36.7 |
| Altamonte Springs: | 43.1 |
| Winter Park: | 24.3 |
| Lake Mary: | 20.7 |
| Oviedo: | 28.8 |
| Orlando: | 19.3 |
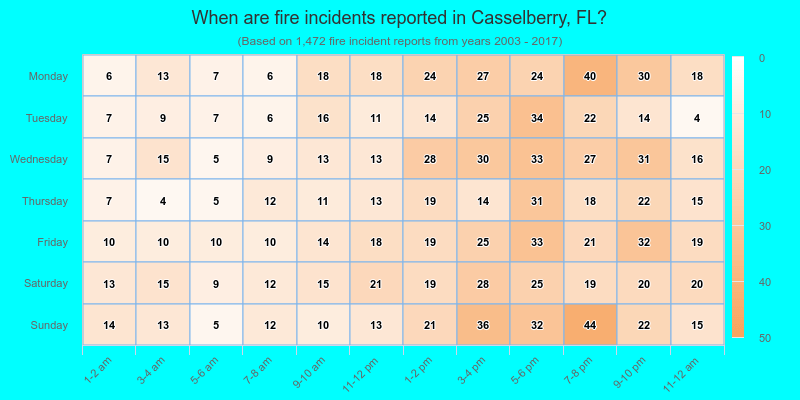
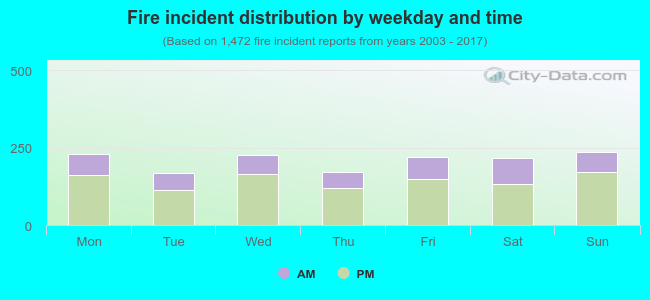 31.4% incidents where reported in the morning and 68.6% in the evening. The most fires (16.1%) took place on Sunday, and the least (11.5%) on Tuesday.
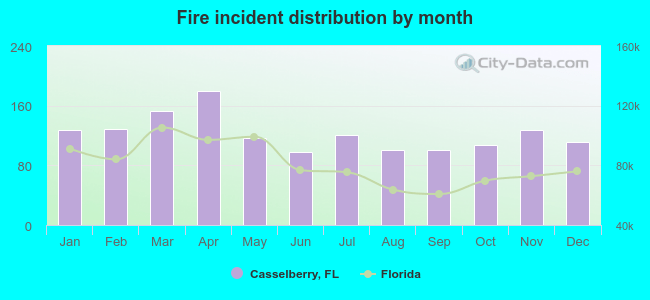 According to the 1,472 fire incident reports from years 2003 - 2017 most fires (12.2%) took place during April, and the least (6.7%) in June.
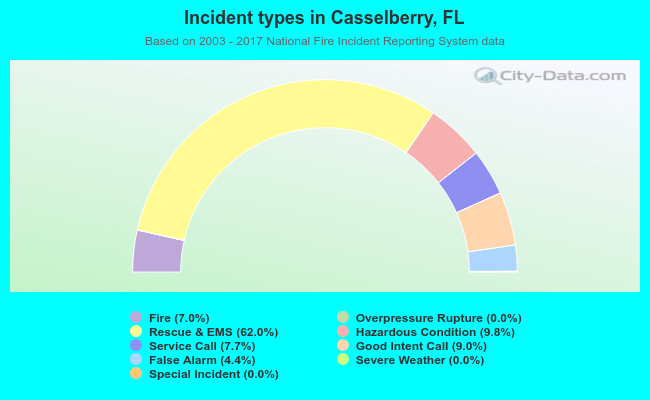 Out of all 20,988 cases reported during the years 2003 - 2017, the most belonged to the categories: Rescue & EMS (62.0%), Hazardous Condition (9.8%), and Good Intent Call (9.0%).
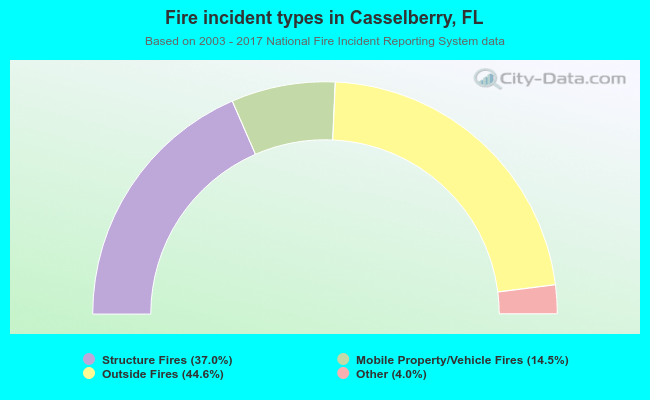 When looking into fire subcategories, the most incidents belonged to: Outside Fires (44.6%), and Structure Fires (37.0%).