Longwood: Fire Incidents, Florida (FL)
Where are fire incidents reported in Longwood, FL
Something went wrong! Please refresh the page.
| Fire incidents reported | |
|---|---|
| Sreet name | Count |
| W SR 434 | 128 |
| N US 17 92 | 80 |
| US HWY 1792 | 50 |
| W I4 | 44 |
| SR 434 | 40 |
| S US 17 92 | 36 |
| SR 419 | 30 |
| E CHURCH AVE | 26 |
| SEMINOLE AVE | 24 |
| SABAL LAKE DR | 22 |
| SUNSET DR | 22 |
| LORMANN CIR | 20 |
| N CR 427 | 20 |
| ORANGE AVE | 20 |
| SPRINGWOOD CIR | 20 |
| WEKIVA SPRINGS RD | 20 |
| E SR 434 | 18 |
| LAND AVE | 18 |
| W WARREN AVE | 18 |
| S WAYMAN ST | 16 |
| SUMMIT RIDGE PL | 16 |
| WEKIVA SPRINGS RD | 16 |
| E WARREN AVE | 14 |
| LONGDALE AVE | 14 |
| MM 95 | 14 |
| BENNETT DR | 12 |
| DUNCAN TRL | 12 |
| E SR 434 / S US 17 92 | 12 |
| GENERAL HUTCHISON PKWY | 12 |
| GEORGIA AVE | 12 |
| Other | 843 |
2003 - 2017 National Fire Incident Reporting System (NFIRS) incidents
- Incident types reported to NFIRS in Longwood, FL
- 10,82954.7%Rescue & EMS
- 2,21111.2%Good Intent Call
- 2,19811.1%Hazardous Condition
- 1,6828.5%Service Call
- 1,6498.3%Fire
- 1,1886.0%False Alarm
- Fire incident types reported to NFIRS in Longwood, FL
- 71743.5%Outside Fires
- 55733.8%Structure Fires
- 27216.5%Mobile Property/Vehicle Fires
- 1036.2%Other
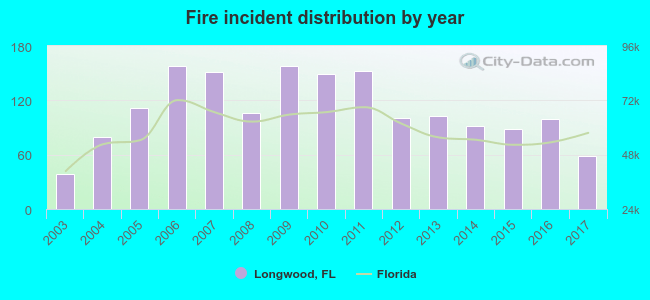 According to the data from the years 2003 - 2017 the average number of fire incidents per year is 110. The highest number of fires - 158 took place in 2006, and the least - 39 in 2003. The data has a growing trend.
The average number of yearly fire incidents per 10k residents in Longwood, FL compared to nearest cities:
(Note: Based on data for the last 3 years, including only cities with population 5,000 and above)
| Longwood: | 38.7 |
| Casselberry: | 16.5 |
| Fern Park: | 13.8 |
| Lake Mary: | 18.4 |
| Altamonte Springs: | 16.7 |
| Winter Springs: | 11.3 |
| Maitland: | 21.6 |
| Winter Park: | 32.9 |
| Sanford: | 49.8 |
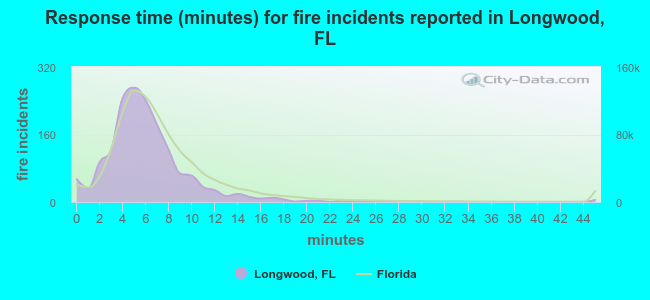 The median response time based on all reported fire incidents is 5 minutes. This is lower than the state median value.
The median response time in Longwood, FL compared to nearest cities:
(Note: Based on data for all years, including only cities with at least 500 fire incidents)
| Longwood: | 5 minutes |
| Casselberry: | 5 minutes |
| Lake Mary: | 6 minutes |
| Altamonte Springs: | 5 minutes |
| Winter Springs: | 5 minutes |
| Maitland: | 5 minutes |
| Winter Park: | 6 minutes |
| Sanford: | 6 minutes |
| Oviedo: | 6 minutes |
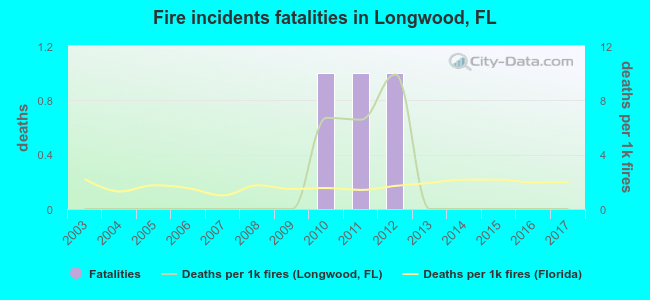 Based on the data from the years 2003 - 2017 the average number of fire-related fatalities per year is 0. The highest number of deaths - 1 took place in 2010, and the lowest - 0 in 2003. The data has a constant trend.
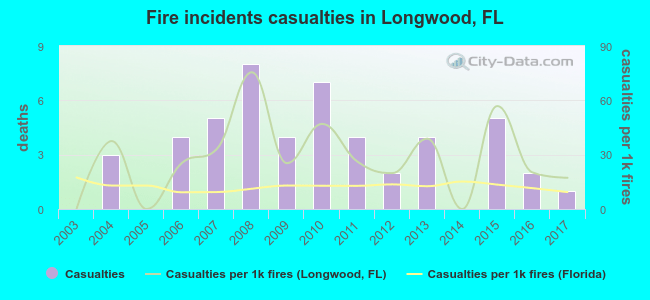 Based on the reports from the years 2003 - 2017 the average number of fire-related casualties per year is 3. The highest number of casualties - 8 took place in 2008, and the lowest - 0 in 2003. The data has an increasing trend.
The average number of injuries per 1,000 fires is 28. This indicator was the highest - 75 in 2008, and the lowest 0 in 2003. The trend for injuries per 1,000 fires is increasing. Compared to the state value the number of casualties per 1,000 fire incidents is much higher.
Based on the reports from the years 2003 - 2017 the average number of fire-related casualties per year is 3. The highest number of casualties - 8 took place in 2008, and the lowest - 0 in 2003. The data has an increasing trend.
The average number of injuries per 1,000 fires is 28. This indicator was the highest - 75 in 2008, and the lowest 0 in 2003. The trend for injuries per 1,000 fires is increasing. Compared to the state value the number of casualties per 1,000 fire incidents is much higher.Casualties per 1,000 incidents in Longwood, FL compared to nearest cities:
(Note: Based on data for all years, including only cities with at least 500 fire incidents)
| Longwood: | 29.7 |
| Casselberry: | 20.4 |
| Lake Mary: | 20.7 |
| Altamonte Springs: | 43.1 |
| Winter Springs: | 36.7 |
| Maitland: | 14.0 |
| Winter Park: | 24.3 |
| Sanford: | 13.4 |
| Oviedo: | 28.8 |
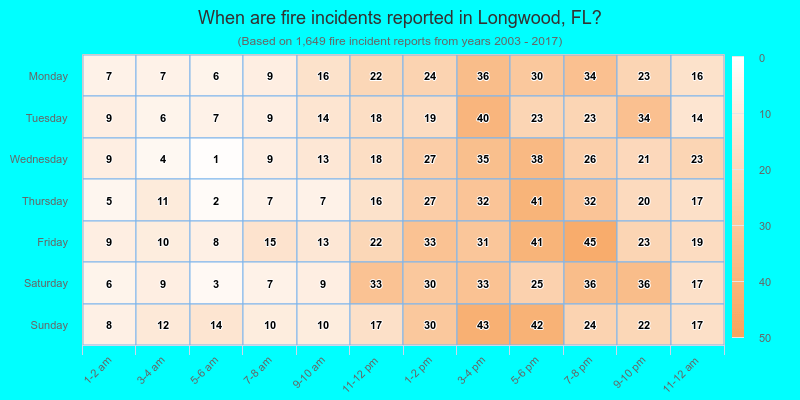
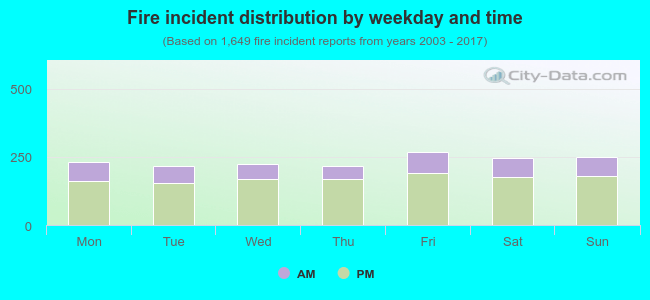 27.1% incidents where reported in the morning and 72.9% in the evening. The most fires (16.3%) took place on Friday, and the least (13.1%) on Tuesday.
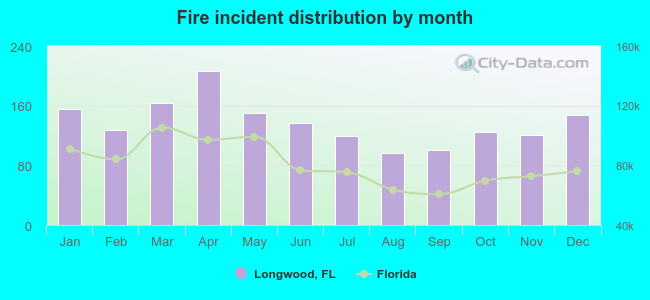 According to the 1,649 incident reports from years 2003 - 2017 most fires (12.6%) took place during April, and the least (5.8%) in August.
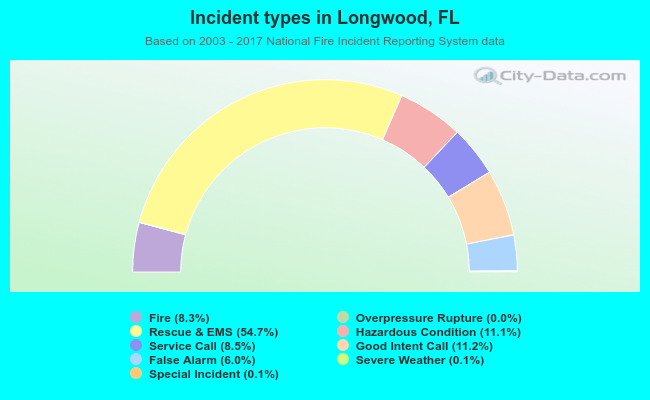 Out of all 19,798 cases reported during the years 2003 - 2017, the most belonged to the categories: Rescue & EMS (54.7%), Good Intent Call (11.2%), and Hazardous Condition (11.1%).
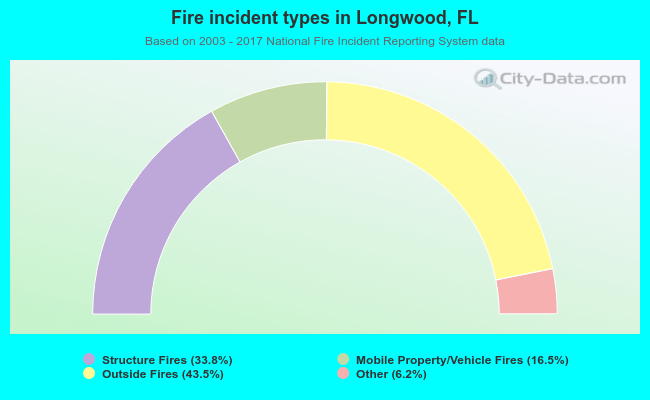 When looking into fire subcategories, the most reports belonged to: Outside Fires (43.5%), and Structure Fires (33.8%).