Catasauqua: Fire Incidents, Pennsylvania (PA)
Where are fire incidents reported in Catasauqua, PA
Something went wrong! Please refresh the page.
|
| |||||||||||||||||||||||||||||||||||||||||||||||||||||||||||||||||||||||||||||||||||||||||||||||||||||||||||||
2006 - 2018 National Fire Incident Reporting System (NFIRS) incidents
- Incident types reported to NFIRS in Catasauqua, PA
- 41424.6%Fire
- 40724.2%Hazardous Condition
- 30418.1%Service Call
- 23914.2%False Alarm
- 21312.6%Rescue & EMS
- 1005.9%Good Intent Call
- 70.4%Special Incident
- Fire incident types reported to NFIRS in Catasauqua, PA
- 26864.7%Structure Fires
- 8721.0%Outside Fires
- 307.2%Other
- 297.0%Mobile Property/Vehicle Fires
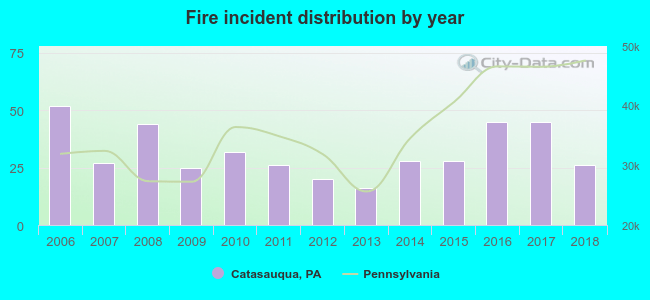 Based on the data from the years 2006 - 2018 the average number of fires per year is 32. The highest number of reported fires - 52 took place in 2006, and the least - 16 in 2013. The data has a declining trend.
The average number of yearly fire incidents per 10k residents in Catasauqua, PA compared to nearest cities:
(Note: Based on data for the last 3 years, including only cities with population 5,000 and above)
| Catasauqua: | 59.4 |
| Northampton: | 71.3 |
| Allentown: | 11.6 |
| Bethlehem: | 29.6 |
| Wescosville: | 18.2 |
| Emmaus: | 31.8 |
| Hellertown: | 22.2 |
| Nazareth: | 52.5 |
| Wilson: | 3.2 |
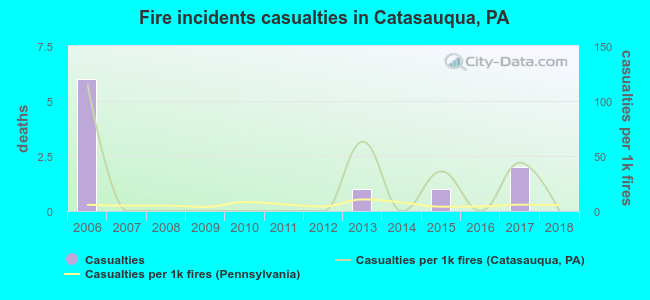 According to the data from the years 2006 - 2018 the average number of fire-related yearly casualties is 1. The highest number of injuries - 6 took place in 2006, and the lowest - 0 in 2007. The data has a declining trend.
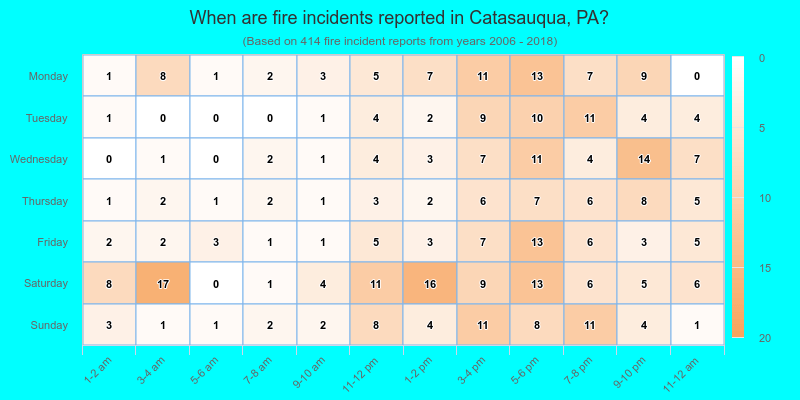
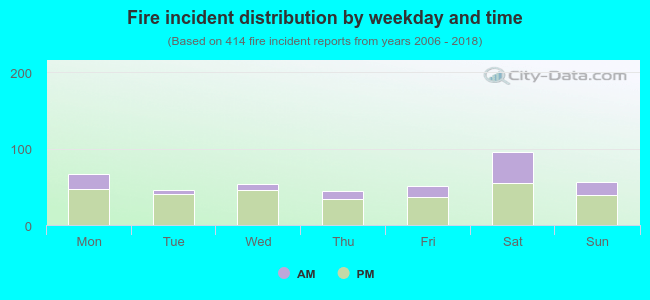 28.0% incidents where reported in the morning and 72.0% in the evening. The most fires (23.2%) took place on Saturday, and the least (10.6%) on Thursday.
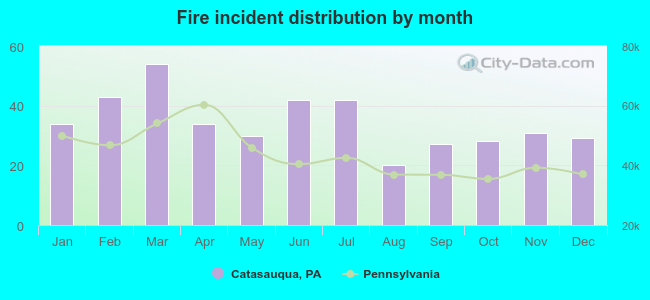 According to the 414 fires from years 2006 - 2018 most fires (13.0%) took place during March, and the least (4.8%) in August.
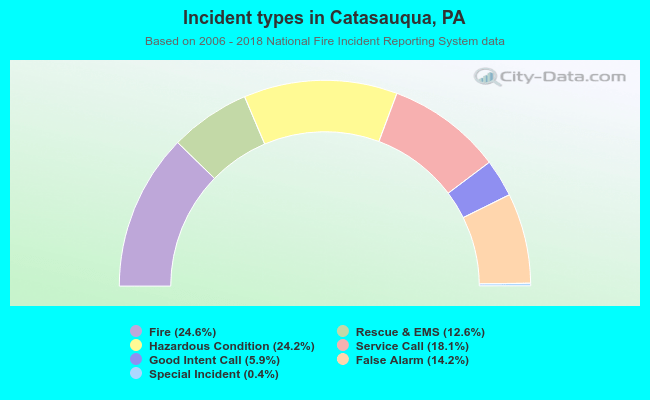 Out of all 1,684 cases reported during the years 2006 - 2018, the most belonged to the categories: Fire (24.6%), Rescue & EMS (24.2%), and Hazardous Condition (18.1%).
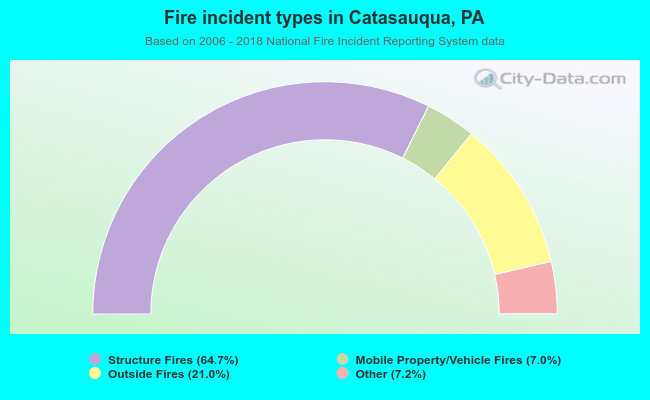 When looking into fire subcategories, the most incidents belonged to: Structure Fires (64.7%), and Outside Fires (21.0%).