Bethlehem: Fire Incidents, Pennsylvania (PA)
Where are fire incidents reported in Bethlehem, PA
Something went wrong! Please refresh the page.
| Fire incidents reported | |
|---|---|
| Sreet name | Count |
| SANDS BLVD | 64 |
| SCHOENERSVILLE RD | 54 |
| BROAD ST | 50 |
| 4TH ST | 48 |
| SANDS BLVD | 44 |
| 3RD ST | 42 |
| MAIN ST | 38 |
| MAIN ST | 36 |
| ROUTE 22 | 36 |
| E 4TH ST | 34 |
| EASTON AVE | 34 |
| UNION BLVD | 34 |
| NAZARETH PIKE | 32 |
| STEFKO BLVD | 30 |
| BROADWAY | 28 |
| HANOVERVILLE RD | 26 |
| HELLERTOWN RD | 26 |
| LIVINGSTON ST | 26 |
| WYANDOTTE ST | 26 |
| STEFKO BLVD | 24 |
| CENTER ST | 22 |
| FREEMANSBURG AVE | 22 |
| LINDEN ST | 22 |
| 8TH AVE | 20 |
| CLUB AVE | 20 |
| LINDEN ST | 20 |
| LIVINGSTON ST | 20 |
| SCHOENERSVILLE RD | 20 |
| SENECA ST | 20 |
| WESTGATE DR | 20 |
| Other | 1,259 |
2004 - 2018 National Fire Incident Reporting System (NFIRS) incidents
- Incident types reported to NFIRS in Bethlehem, PA
- 8,22836.4%Rescue & EMS
- 4,47619.8%Hazardous Condition
- 3,66116.2%False Alarm
- 2,41610.7%Good Intent Call
- 2,1979.7%Fire
- 1,4966.6%Service Call
- 470.2%Special Incident
- 420.2%Severe Weather
- 270.1%Overpressure Rupture
- Fire incident types reported to NFIRS in Bethlehem, PA
- 1,13051.4%Structure Fires
- 60727.6%Outside Fires
- 35416.1%Mobile Property/Vehicle Fires
- 1064.8%Other
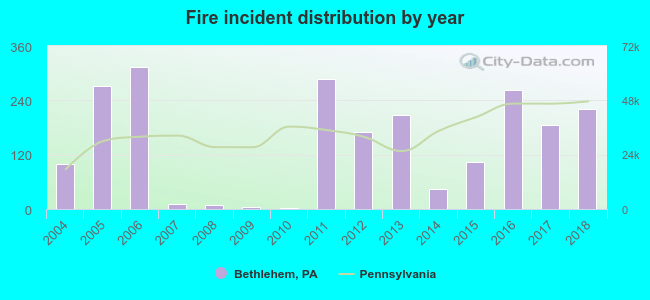 According to the data from the years 2004 - 2018 the average number of fire incidents per year is 146. The highest number of fires - 314 took place in 2006, and the least - 2 in 2010. The data has a rising trend.
The average number of yearly fire incidents per 10k residents in Bethlehem, PA compared to nearest cities:
(Note: Based on data for the last 3 years, including only cities with population 5,000 and above)
| Bethlehem: | 29.6 |
| Hellertown: | 22.2 |
| Catasauqua: | 59.4 |
| Allentown: | 11.6 |
| Northampton: | 71.3 |
| Wilson: | 3.2 |
| Nazareth: | 52.5 |
| Emmaus: | 31.8 |
| Easton: | 77.1 |
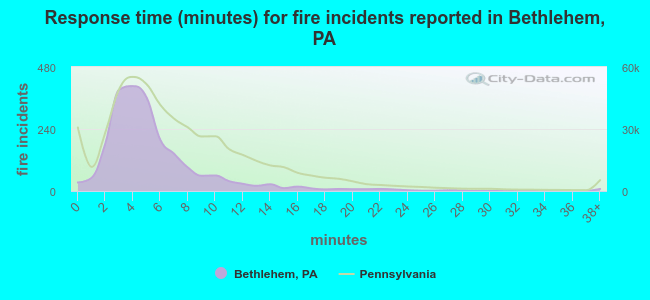 The median response time based on all reported fire incidents is 5 minutes. This is lower than the Pennsylvania median value.
The median response time in Bethlehem, PA compared to nearest cities:
(Note: Based on data for all years, including only cities with at least 500 fire incidents)
| Bethlehem: | 5 minutes |
| Allentown: | 6 minutes |
| Northampton: | 11 minutes |
| Easton: | 4 minutes |
| Phillipsburg: | 5 minutes |
| Quakertown: | 7 minutes |
| Perkasie: | 6 minutes |
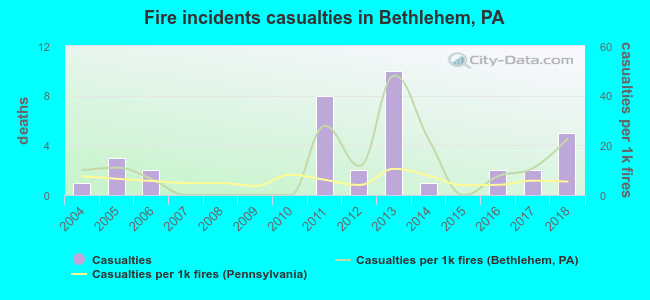 Based on the data from the years 2004 - 2018 the average number of fire-related casualties per year is 2. The highest number of injuries - 10 took place in 2013, and the lowest - 0 in 2007. The data has a growing trend.
The average number of injuries per 1,000 fires is 12. This indicator was the highest - 48 in 2013, and the lowest 0 in 2007. The trend for injuries per 1,000 incidents is rising. Compared to the state value the number of casualties per 1,000 fire incidents is much higher.
Based on the data from the years 2004 - 2018 the average number of fire-related casualties per year is 2. The highest number of injuries - 10 took place in 2013, and the lowest - 0 in 2007. The data has a growing trend.
The average number of injuries per 1,000 fires is 12. This indicator was the highest - 48 in 2013, and the lowest 0 in 2007. The trend for injuries per 1,000 incidents is rising. Compared to the state value the number of casualties per 1,000 fire incidents is much higher.Casualties per 1,000 incidents in Bethlehem, PA compared to nearest cities:
(Note: Based on data for all years, including only cities with at least 500 fire incidents)
| Bethlehem: | 16.4 |
| Allentown: | 0.4 |
| Northampton: | 3.3 |
| Easton: | 17.2 |
| Phillipsburg: | 32.3 |
| Quakertown: | 6.6 |
| Perkasie: | 5.6 |
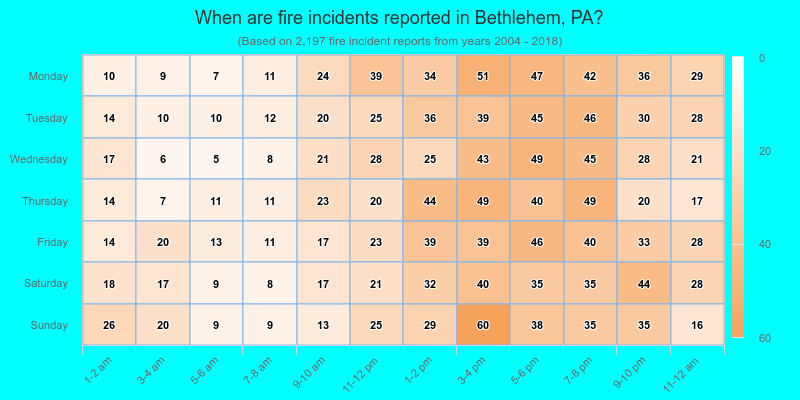
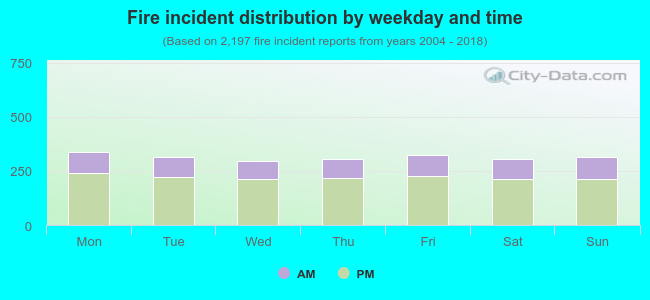 29.7% incidents where reported in the morning and 70.3% in the evening. The most fires (15.4%) took place on Monday, and the least (13.5%) on Wednesday.
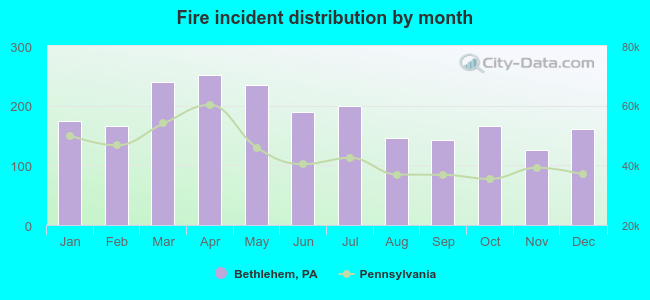 According to the 2,197 fire incident reports from years 2004 - 2018 most fires (11.4%) took place during April, and the least (5.7%) in November.
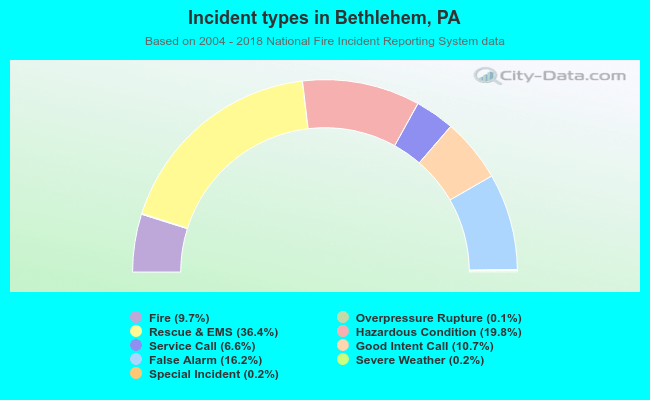 Out of all 22,590 cases reported during the years 2004 - 2018, the most belonged to the categories: Rescue & EMS (36.4%), Hazardous Condition (19.8%), and False Alarm (16.2%).
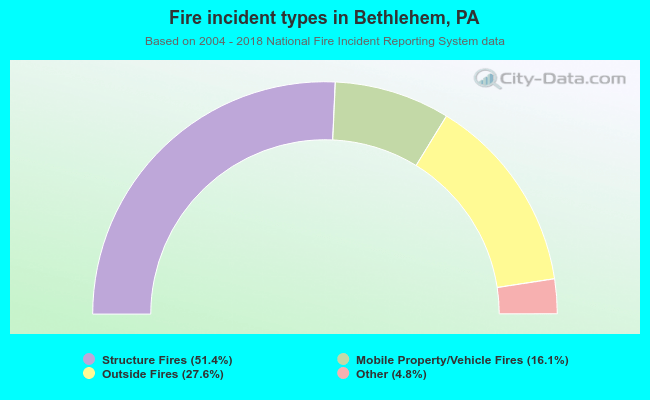 When looking into fire subcategories, the most reports belonged to: Structure Fires (51.4%), and Outside Fires (27.6%).