Hellertown: Fire Incidents, Pennsylvania (PA)
Where are fire incidents reported in Hellertown, PA
Something went wrong! Please refresh the page.
|
| |||||||||||||||||||||||||||||||||||||||||||||||||||||||||||||||||||||||||||||||||||||||||||||||||||||||||||||
2005 - 2018 National Fire Incident Reporting System (NFIRS) incidents
- Incident types reported to NFIRS in Hellertown, PA
- 19328.8%Good Intent Call
- 12418.5%False Alarm
- 11417.0%Fire
- 10315.4%Rescue & EMS
- 6810.1%Hazardous Condition
- 355.2%Special Incident
- 324.8%Service Call
- 10.1%Severe Weather
- Fire incident types reported to NFIRS in Hellertown, PA
- 7162.3%Structure Fires
- 2017.5%Outside Fires
- 1614.0%Mobile Property/Vehicle Fires
- 76.1%Other
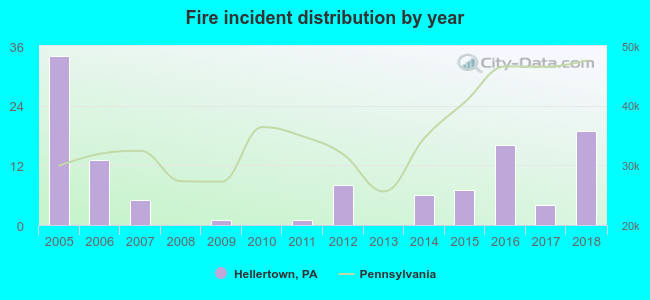 Based on the data from the years 2005 - 2018 the average number of fires per year is 8. The highest number of fire incidents - 34 took place in 2005, and the least - 0 in 2008. The data has a dropping trend.
The average number of yearly fire incidents per 10k residents in Hellertown, PA compared to nearest cities:
(Note: Based on data for the last 3 years, including only cities with population 5,000 and above)
| Hellertown: | 22.2 |
| Bethlehem: | 29.6 |
| Allentown: | 11.6 |
| Catasauqua: | 59.4 |
| Wilson: | 3.2 |
| Emmaus: | 31.8 |
| Easton: | 77.1 |
| Quakertown: | 61.6 |
| Northampton: | 71.3 |
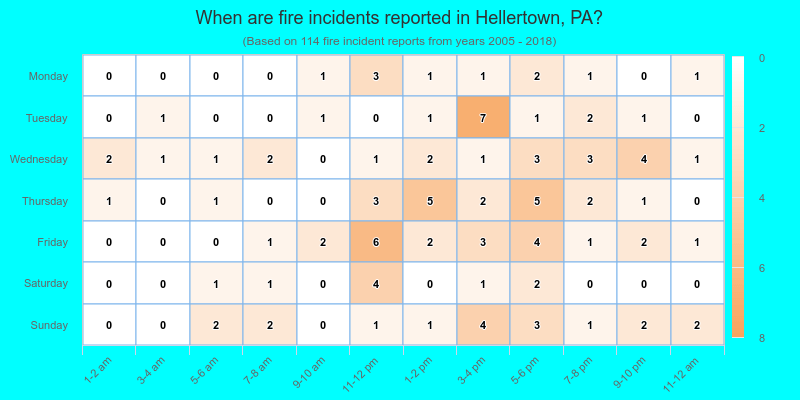
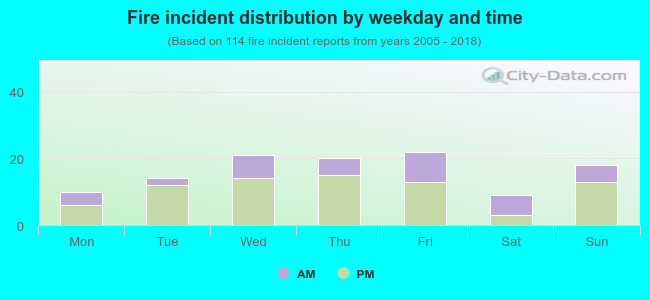 33.3% incidents where reported in the morning and 66.7% in the evening. The most fires (19.3%) took place on Friday, and the least (7.9%) on Saturday.
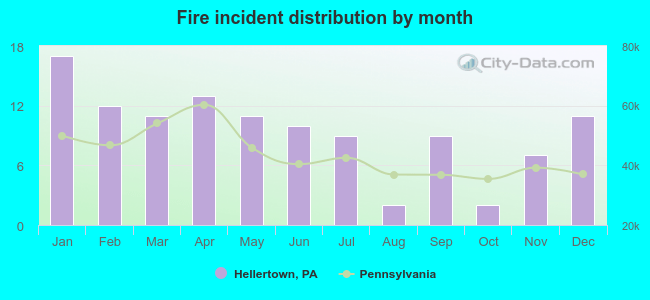 According to the 114 fire incidents from years 2005 - 2018 most fires (14.9%) took place during January, and the least (1.8%) in August.
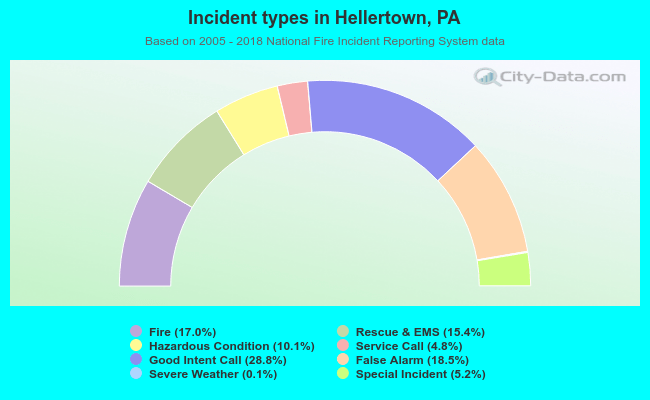 Out of all 670 cases reported during the years 2005 - 2018, the most belonged to the categories: Service Call (28.8%), Good Intent Call (18.5%), and Fire (17.0%).
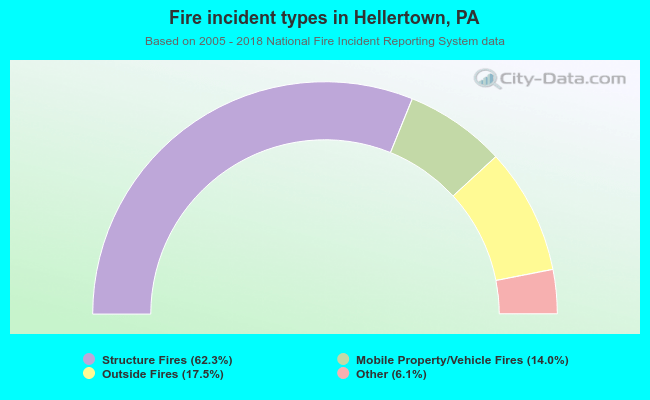 When looking into fire subcategories, the most incidents belonged to: Structure Fires (62.3%), and Outside Fires (17.5%).