Cedar Rapids: Fire Incidents, Iowa (IA)
Where are fire incidents reported in Cedar Rapids, IA
Something went wrong! Please refresh the page.
| Fire incidents reported | |
|---|---|
| Sreet name | Count |
| 1ST AVE | 312 |
| 6TH ST | 196 |
| EDGEWOOD RD | 166 |
| BLAIRS FERRY RD | 164 |
| C ST | 162 |
| 16TH AVE | 130 |
| 1ST AV | 106 |
| COLLINS RD | 104 |
| J ST | 98 |
| 15TH ST | 96 |
| CENTER POINT RD | 88 |
| I380 NB | 88 |
| A AVE | 82 |
| 16TH ST | 80 |
| 2ND ST | 80 |
| OAKLAND RD | 78 |
| 5TH AVE | 76 |
| KIRKWOOD BLVD | 76 |
| BEVER AVE | 72 |
| C AVE | 72 |
| I380 SB | 70 |
| 2ND AVE | 68 |
| 9TH ST | 68 |
| 10TH ST | 66 |
| 18TH ST | 64 |
| WENIG RD | 64 |
| 3RD ST | 62 |
| GLASS RD | 62 |
| JACOLYN DR | 62 |
| 4TH AVE | 58 |
| Other | 1,868 |
2002 - 2018 National Fire Incident Reporting System (NFIRS) incidents
- Incident types reported to NFIRS in Cedar Rapids, IA
- 24,23546.0%Rescue & EMS
- 10,46219.8%Good Intent Call
- 4,8389.2%Fire
- 4,8019.1%Service Call
- 4,1527.9%False Alarm
- 4,1237.8%Hazardous Condition
- 550.1%Overpressure Rupture
- Fire incident types reported to NFIRS in Cedar Rapids, IA
- 2,20345.5%Structure Fires
- 1,55032.0%Outside Fires
- 91919.0%Mobile Property/Vehicle Fires
- 1663.4%Other
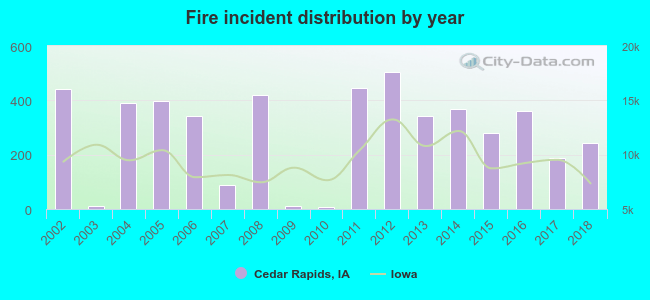 Based on the data from the years 2002 - 2018 the average number of fire incidents per year is 285. The highest number of reported fire incidents - 503 took place in 2012, and the least - 6 in 2010. The data has a declining trend.
The average number of yearly fire incidents per 10k residents in Cedar Rapids, IA compared to nearest cities:
(Note: Based on data for the last 3 years, including only cities with population 5,000 and above)
| Cedar Rapids: | 20.4 |
| Hiawatha: | 46.8 |
| Marion: | 16.2 |
| North Liberty: | 15.4 |
| Coralville: | 17.0 |
| Anamosa: | 15.4 |
| Vinton: | 29.1 |
| Iowa City: | 9.8 |
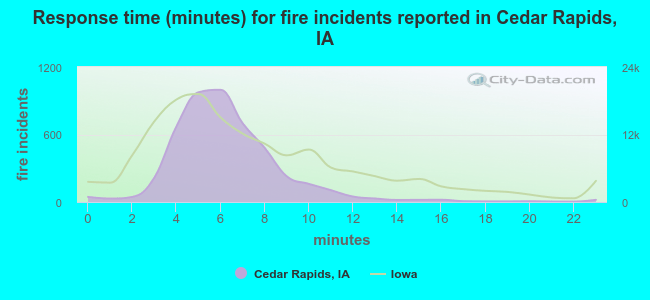 The median response time based on all reported fire incidents is 6 minutes. This is similar to the Iowa median value.
The median response time in Cedar Rapids, IA compared to nearest cities:
(Note: Based on data for all years, including only cities with at least 500 fire incidents)
| Cedar Rapids: | 6 minutes |
| Marion: | 5 minutes |
| Coralville: | 7 minutes |
| Iowa City: | 5 minutes |
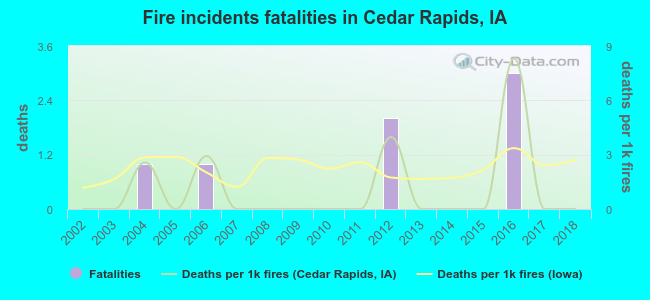 Based on the reports from the years 2002 - 2018 the average number of fire-related yearly deaths is 0. The highest number of reported deaths - 3 took place in 2016, and the lowest - 0 in 2002. The data has a constant trend.
The average number of fatalities per 1,000 fire incidents is 1. This indicator was the highest - 8 in 2016, and the lowest 0 in 2002. The trend for deaths per 1,000 fire incidents is constant. Compared to the state value the number of deaths per 1,000 fires is lower.
Based on the reports from the years 2002 - 2018 the average number of fire-related yearly deaths is 0. The highest number of reported deaths - 3 took place in 2016, and the lowest - 0 in 2002. The data has a constant trend.
The average number of fatalities per 1,000 fire incidents is 1. This indicator was the highest - 8 in 2016, and the lowest 0 in 2002. The trend for deaths per 1,000 fire incidents is constant. Compared to the state value the number of deaths per 1,000 fires is lower.Deaths per 1,000 incidents in Cedar Rapids, IA compared to nearest cities:
(Note: Based on data for all years, including only cities with at least 2,500 fire incidents)
| Cedar Rapids: | 1.4 |
| Iowa City: | 0.0 |
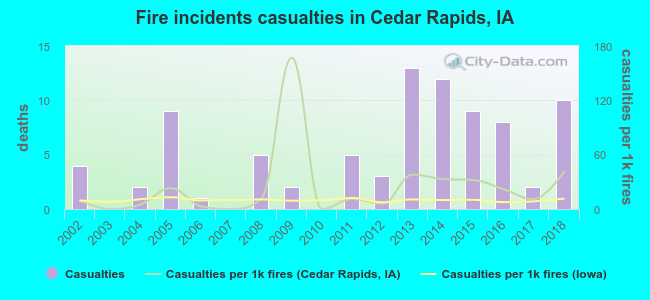 According to the data from the years 2002 - 2018 the average number of fire-related yearly casualties is 5. The highest number of reported casualties - 13 took place in 2013, and the lowest - 0 in 2003. The data has an increasing trend.
The average number of injuries per 1,000 fire incidents is 24. This indicator was the highest - 167 in 2009, and the lowest 0 in 2003. The trend for injuries per 1,000 fire incidents is growing. Compared to the Iowa value the number of injuries per 1,000 fire incidents is higher.
According to the data from the years 2002 - 2018 the average number of fire-related yearly casualties is 5. The highest number of reported casualties - 13 took place in 2013, and the lowest - 0 in 2003. The data has an increasing trend.
The average number of injuries per 1,000 fire incidents is 24. This indicator was the highest - 167 in 2009, and the lowest 0 in 2003. The trend for injuries per 1,000 fire incidents is growing. Compared to the Iowa value the number of injuries per 1,000 fire incidents is higher.Casualties per 1,000 incidents in Cedar Rapids, IA compared to nearest cities:
(Note: Based on data for all years, including only cities with at least 500 fire incidents)
| Cedar Rapids: | 17.6 |
| Marion: | 18.7 |
| Coralville: | 10.7 |
| Iowa City: | 13.8 |
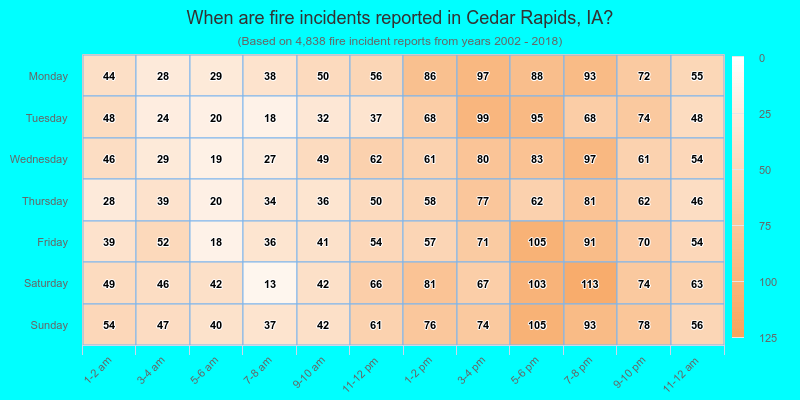
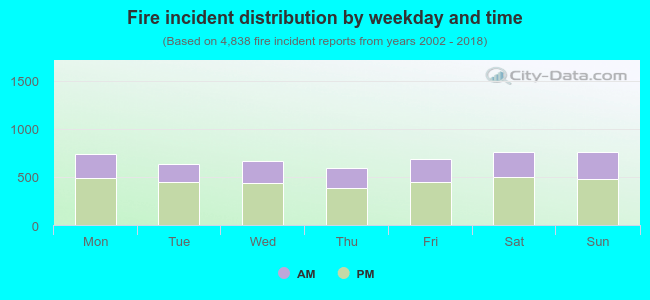 33.9% incidents where reported in the morning and 66.1% in the evening. The most fires (15.8%) took place on Sunday, and the least (12.3%) on Thursday.
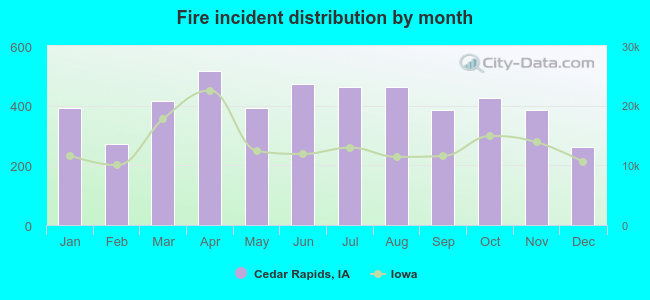 Based on the 4,838 incident reports from years 2002 - 2018 most fires (10.6%) took place during April, and the least (5.4%) in December.
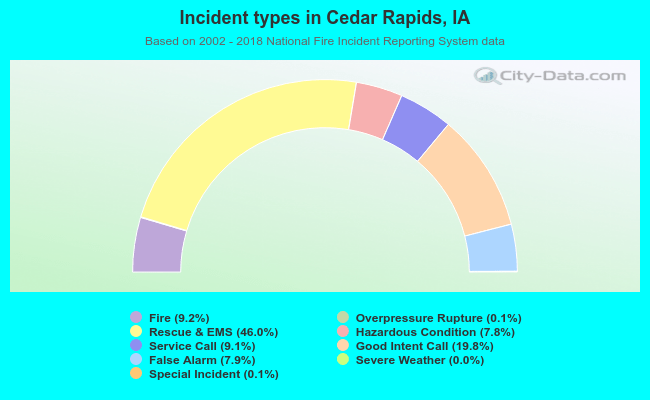 Out of all 52,719 cases reported during the years 2002 - 2018, the most belonged to the categories: Rescue & EMS (46.0%), Good Intent Call (19.8%), and Fire (9.2%).
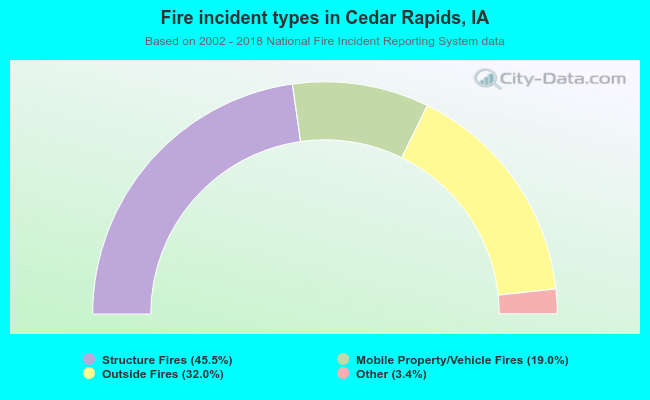 When looking into fire subcategories, the most incidents belonged to: Structure Fires (45.5%), and Outside Fires (32.0%).