Iowa City: Fire Incidents, Iowa (IA)
Where are fire incidents reported in Iowa City, IA
Something went wrong! Please refresh the page.
| Fire incidents reported | |
|---|---|
| Sreet name | Count |
| DUBUQUE ST | 240 |
| WASHINGTON ST | 190 |
| DODGE ST | 180 |
| GILBERT ST | 180 |
| JOHNSON ST | 168 |
| RIVERSIDE DR | 156 |
| CLINTON ST | 150 |
| BURLINGTON ST | 138 |
| VAN BUREN ST | 128 |
| LINN ST | 112 |
| COLLEGE ST | 94 |
| HAWKINS DR | 94 |
| BROADWAY ST | 88 |
| IOWA AVE | 82 |
| COURT ST | 80 |
| MARKET ST | 80 |
| CAPITOL ST | 74 |
| LUCAS ST | 66 |
| JEFFERSON ST | 60 |
| BENTON ST | 58 |
| HIGHWAY #6 | 58 |
| BOWERY ST | 56 |
| SCOTT BLVD | 56 |
| MORMON TREK BLVD | 54 |
| ARTHUR ST | 50 |
| BLOOMINGTON ST | 50 |
| INTERSTATE 80 | 50 |
| BARTELT RD | 46 |
| DAVENPORT ST | 46 |
| HWY 6 | 46 |
| Other | 339 |
2002 - 2018 National Fire Incident Reporting System (NFIRS) incidents
- Incident types reported to NFIRS in Iowa City, IA
- 11,46247.9%Rescue & EMS
- 3,26913.6%Fire
- 3,10012.9%False Alarm
- 2,45510.2%Hazardous Condition
- 2,1479.0%Good Intent Call
- 1,2795.3%Service Call
- 1250.5%Overpressure Rupture
- 1000.4%Special Incident
- Fire incident types reported to NFIRS in Iowa City, IA
- 1,41243.2%Structure Fires
- 1,34441.1%Outside Fires
- 40212.3%Mobile Property/Vehicle Fires
- 1113.4%Other
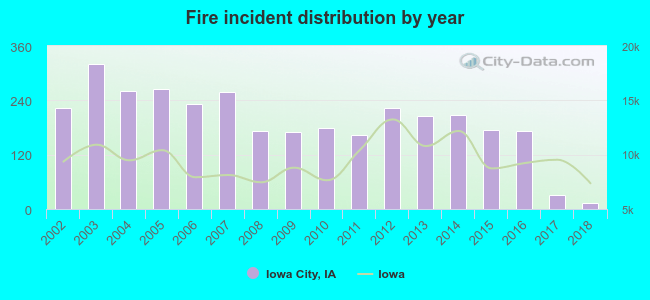 Based on the data from the years 2002 - 2018 the average number of fires per year is 192. The highest number of fires - 320 took place in 2003, and the least - 13 in 2018. The data has a dropping trend.
The average number of yearly fire incidents per 10k residents in Iowa City, IA compared to nearest cities:
(Note: Based on data for the last 3 years, including only cities with population 5,000 and above)
| Iowa City: | 9.8 |
| Coralville: | 17.0 |
| North Liberty: | 15.4 |
| Cedar Rapids: | 20.4 |
| Washington: | 43.5 |
| Marion: | 16.2 |
| Hiawatha: | 46.8 |
| Muscatine: | 30.4 |
| Anamosa: | 15.4 |
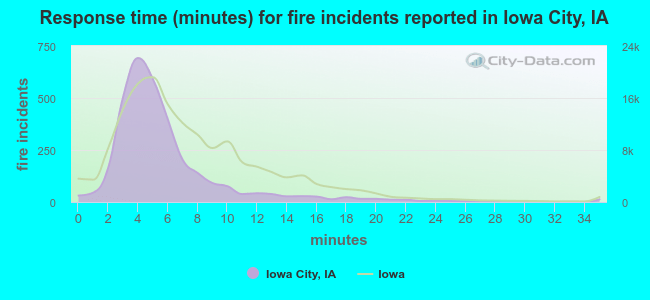 The median response time based on all reported fire incidents is 5 minutes. This is lower than the Iowa median value.
The median response time in Iowa City, IA compared to nearest cities:
(Note: Based on data for all years, including only cities with at least 500 fire incidents)
| Iowa City: | 5 minutes |
| Coralville: | 7 minutes |
| Cedar Rapids: | 6 minutes |
| Washington: | 6 minutes |
| Marion: | 5 minutes |
| Muscatine: | 5 minutes |
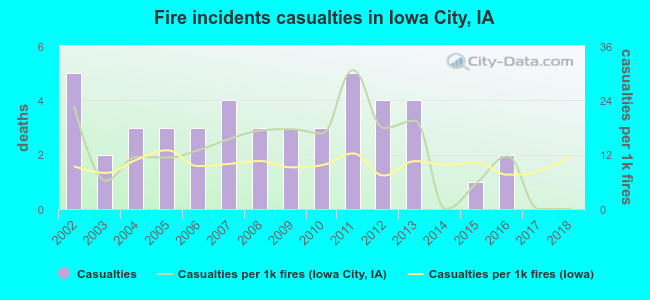 Based on the reports from the years 2002 - 2018 the average number of fire-related yearly casualties is 3. The highest number of casualties - 5 took place in 2002, and the lowest - 0 in 2014. The data has a dropping trend.
The average number of casualties per 1,000 fire incidents is 13. This indicator was the highest - 31 in 2011, and the lowest 0 in 2014. The trend for injuries per 1,000 incidents is decreasing. Compared to the Iowa value the number of injuries per 1,000 fire incidents is higher.
Based on the reports from the years 2002 - 2018 the average number of fire-related yearly casualties is 3. The highest number of casualties - 5 took place in 2002, and the lowest - 0 in 2014. The data has a dropping trend.
The average number of casualties per 1,000 fire incidents is 13. This indicator was the highest - 31 in 2011, and the lowest 0 in 2014. The trend for injuries per 1,000 incidents is decreasing. Compared to the Iowa value the number of injuries per 1,000 fire incidents is higher.Casualties per 1,000 incidents in Iowa City, IA compared to nearest cities:
(Note: Based on data for all years, including only cities with at least 500 fire incidents)
| Iowa City: | 13.8 |
| Coralville: | 10.7 |
| Cedar Rapids: | 17.6 |
| Washington: | 3.8 |
| Marion: | 18.7 |
| Muscatine: | 21.0 |
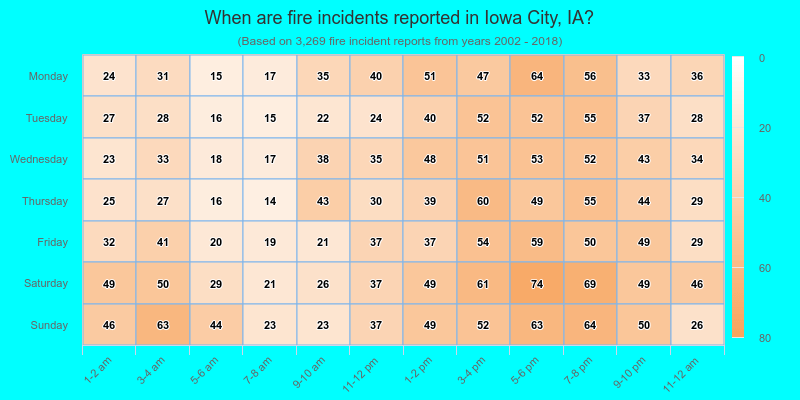
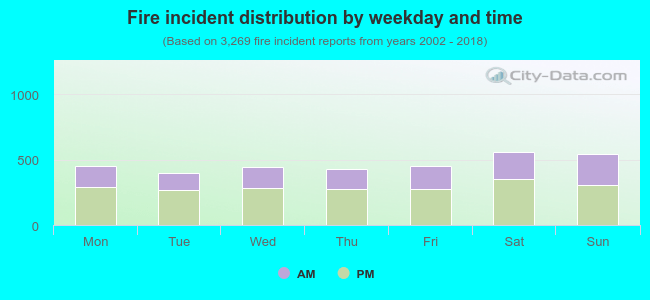 37.7% incidents where reported in the morning and 62.3% in the evening. The most fires (17.1%) took place on Saturday, and the least (12.1%) on Tuesday.
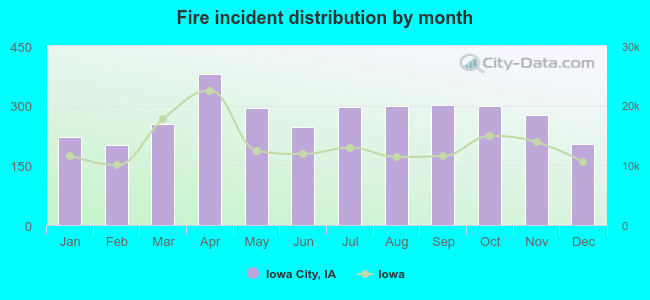 Based on the 3,269 incident reports from years 2002 - 2018 most fires (11.6%) took place during April, and the least (6.1%) in February.
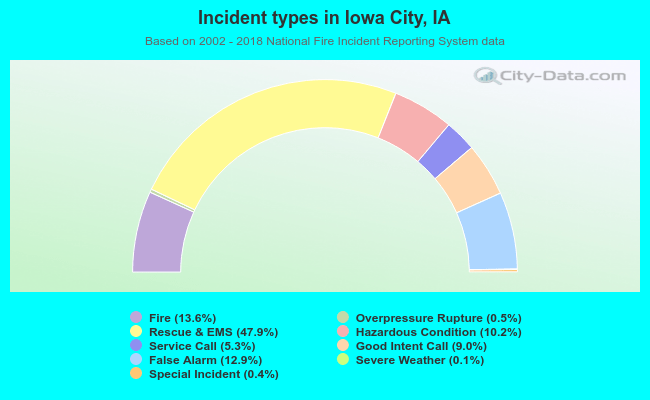 Out of all 23,952 cases reported during the years 2002 - 2018, the most belonged to the categories: Rescue & EMS (47.9%), Fire (13.6%), and False Alarm (12.9%).
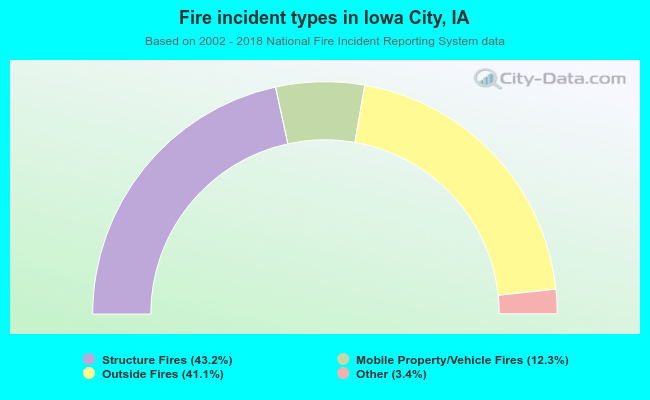 When looking into fire subcategories, the most incidents belonged to: Structure Fires (43.2%), and Outside Fires (41.1%).