Coralville: Fire Incidents, Iowa (IA)
Where are fire incidents reported in Coralville, IA
Something went wrong! Please refresh the page.
| Fire incidents reported | |
|---|---|
| Sreet name | Count |
| 2ND ST | 162 |
| 1ST AVE | 90 |
| 5TH ST | 68 |
| HOLIDAY RD | 64 |
| CORAL RIDGE AVE | 58 |
| I-80 | 50 |
| 9TH ST | 48 |
| 2ND AVE | 46 |
| 12TH AVE | 44 |
| BOSTON WAY | 44 |
| COMMERCE DR | 40 |
| 4TH AVE | 38 |
| 20TH AVE | 34 |
| 6TH ST | 28 |
| 10TH AVE | 24 |
| 10TH ST | 24 |
| 8TH ST | 20 |
| JAMES ST | 20 |
| I-380 | 18 |
| 22ND AVE | 16 |
| CROSSPARK RD | 16 |
| OAKDALE BLVD | 16 |
| 21ST AVE | 14 |
| 23RD AVE | 14 |
| 27TH AVE / HWY 965 | 14 |
| 7TH ST | 14 |
| BROWN DEER RD | 14 |
| CORAL CT | 14 |
| I80 | 14 |
| OLD HOSPITAL RD | 14 |
2002 - 2017 National Fire Incident Reporting System (NFIRS) incidents
- Incident types reported to NFIRS in Coralville, IA
- 1,10929.7%Hazardous Condition
- 88823.8%False Alarm
- 74620.0%Fire
- 49213.2%Rescue & EMS
- 2436.5%Good Intent Call
- 2236.0%Service Call
- 140.4%Overpressure Rupture
- 120.3%Severe Weather
- 40.1%Special Incident
- Fire incident types reported to NFIRS in Coralville, IA
- 39853.4%Structure Fires
- 17423.3%Outside Fires
- 15120.2%Mobile Property/Vehicle Fires
- 233.1%Other
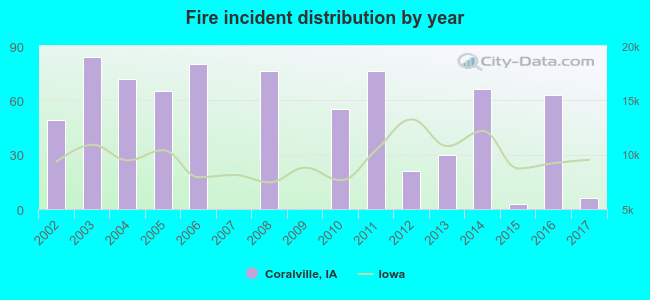 According to the data from the years 2002 - 2017 the average number of fires per year is 47. The highest number of reported fires - 84 took place in 2003, and the least - 0 in 2007. The data has a declining trend.
The average number of yearly fire incidents per 10k residents in Coralville, IA compared to nearest cities:
(Note: Based on data for the last 3 years, including only cities with population 5,000 and above)
| Coralville: | 17.0 |
| Iowa City: | 9.8 |
| North Liberty: | 15.4 |
| Cedar Rapids: | 20.4 |
| Marion: | 16.2 |
| Hiawatha: | 46.8 |
| Washington: | 43.5 |
| Muscatine: | 30.4 |
| Anamosa: | 15.4 |
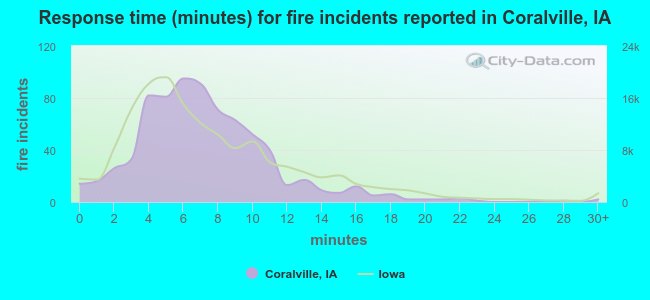 The median response time based on all reported fire incidents is 7 minutes. This is comparable to the Iowa median value.
The median response time in Coralville, IA compared to nearest cities:
(Note: Based on data for all years, including only cities with at least 500 fire incidents)
| Coralville: | 7 minutes |
| Iowa City: | 5 minutes |
| Cedar Rapids: | 6 minutes |
| Marion: | 5 minutes |
| Washington: | 6 minutes |
| Muscatine: | 5 minutes |
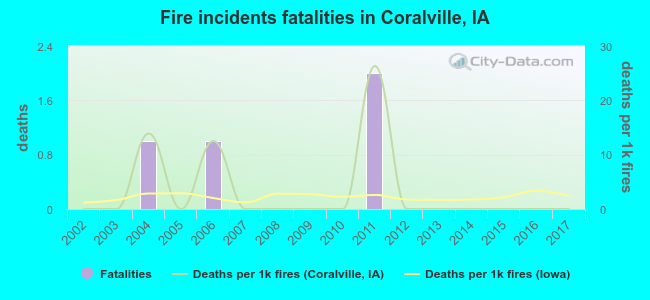 According to the reports from the years 2002 - 2017 the average number of fire-related yearly deaths is 0. The highest number of deaths - 2 took place in 2011, and the lowest - 0 in 2002. The data has a constant trend.
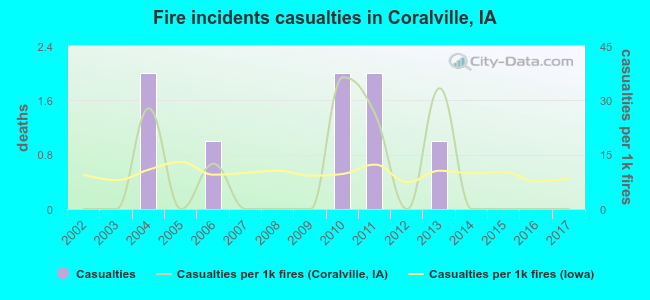 According to the data from the years 2002 - 2017 the average number of fire-related casualties per year is 1. The highest number of injuries - 2 took place in 2004, and the lowest - 0 in 2002. The data has a constant trend.
The average number of casualties per 1,000 fires is 9. This indicator was the highest - 36 in 2010, and the lowest 0 in 2002. The trend for injuries per 1,000 incidents is constant. Compared to the Iowa value the number of casualties per 1,000 fires is about the same.
According to the data from the years 2002 - 2017 the average number of fire-related casualties per year is 1. The highest number of injuries - 2 took place in 2004, and the lowest - 0 in 2002. The data has a constant trend.
The average number of casualties per 1,000 fires is 9. This indicator was the highest - 36 in 2010, and the lowest 0 in 2002. The trend for injuries per 1,000 incidents is constant. Compared to the Iowa value the number of casualties per 1,000 fires is about the same.Casualties per 1,000 incidents in Coralville, IA compared to nearest cities:
(Note: Based on data for all years, including only cities with at least 500 fire incidents)
| Coralville: | 10.7 |
| Iowa City: | 13.8 |
| Cedar Rapids: | 17.6 |
| Marion: | 18.7 |
| Washington: | 3.8 |
| Muscatine: | 21.0 |
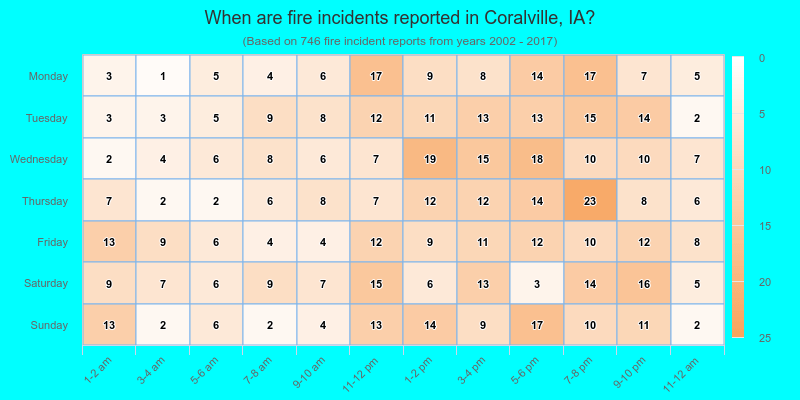
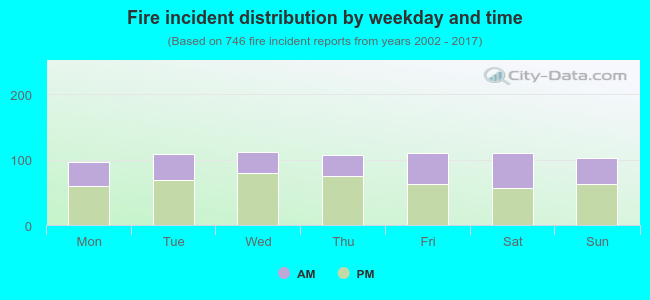 37.8% incidents where reported in the morning and 62.2% in the evening. The most fires (15.0%) took place on Wednesday, and the least (12.9%) on Monday.
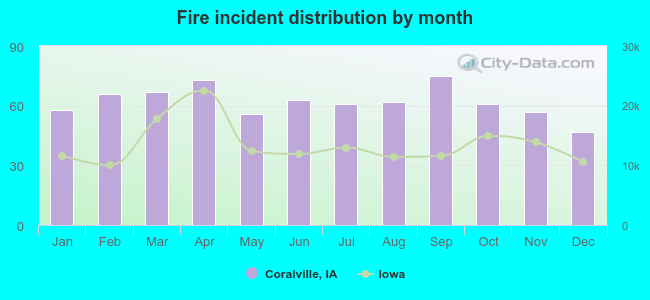 According to the 746 fires from years 2002 - 2017 most fires (10.1%) took place during September, and the least (6.3%) in December.
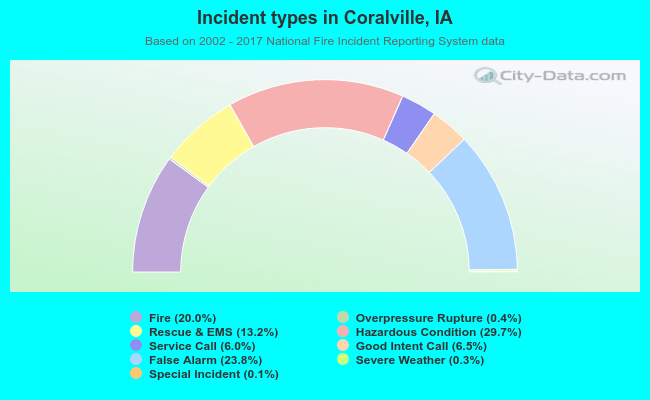 Out of all 3,731 cases reported during the years 2002 - 2017, the most belonged to the categories: Hazardous Condition (29.7%), False Alarm (23.8%), and Fire (20.0%).
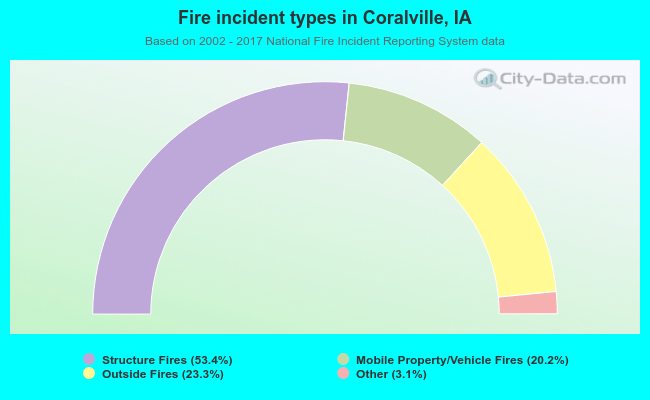 When looking into fire subcategories, the most incidents belonged to: Structure Fires (53.4%), and Outside Fires (23.3%).