Chardon: Fire Incidents, Ohio (OH)
Where are fire incidents reported in Chardon, OH
Something went wrong! Please refresh the page.
| Fire incidents reported | |
|---|---|
| Sreet name | Count |
| CENTER ST | 130 |
| MAYFIELD RD | 110 |
| OLD STATE RD | 106 |
| WATER ST | 82 |
| AUBURN RD | 70 |
| CHARDON WINDSOR RD | 70 |
| GAR HWY | 70 |
| WOODIN RD | 60 |
| PARKER CT | 56 |
| RAVENNA RD | 56 |
| SOUTH ST | 56 |
| CLARIDON TROY RD | 54 |
| ROCK CREEK RD | 52 |
| MENTOR RD | 50 |
| AQUILLA RD | 48 |
| THWING RD | 46 |
| WILSON MILLS RD | 46 |
| HAMBDEN ST | 42 |
| BRAKEMAN RD | 40 |
| LOST POND PKY | 36 |
| TAYLOR WELLS RD | 36 |
| CHARDON AVE | 34 |
| KILE RD | 34 |
| CHARDON RD | 32 |
| CHARDON (RT 6) RD | 30 |
| CLARK RD | 30 |
| ROBINSON RD | 26 |
| GOREDON DR | 22 |
| IRMA DR | 22 |
| LEADER RD | 22 |
2002 - 2018 National Fire Incident Reporting System (NFIRS) incidents
- Incident types reported to NFIRS in Chardon, OH
- 8,20457.0%Rescue & EMS
- 1,74412.1%Hazardous Condition
- 1,46810.2%Fire
- 1,2598.8%Service Call
- 9246.4%False Alarm
- 7395.1%Good Intent Call
- 160.1%Special Incident
- 150.1%Overpressure Rupture
- Fire incident types reported to NFIRS in Chardon, OH
- 87759.7%Structure Fires
- 43829.8%Outside Fires
- 1359.2%Mobile Property/Vehicle Fires
- 181.2%Other
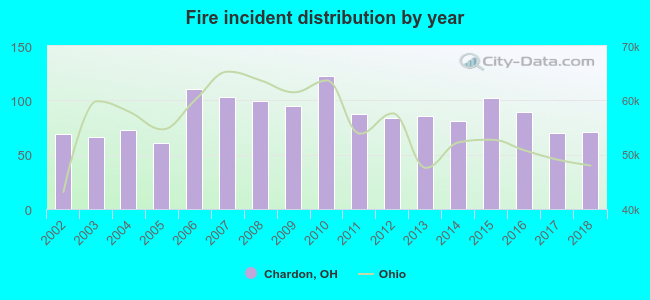 According to the data from the years 2002 - 2018 the average number of fire incidents per year is 86. The highest number of reported fire incidents - 122 took place in 2010, and the least - 61 in 2005. The data has a growing trend.
The average number of yearly fire incidents per 10k residents in Chardon, OH compared to nearest cities:
(Note: Based on data for the last 3 years, including only cities with population 5,000 and above)
| Chardon: | 147.8 |
| Kirtland: | 63.1 |
| Painesville: | 54.8 |
| Mentor: | 21.3 |
| Willoughby: | 58.9 |
| Willoughby Hills: | 56.7 |
| Eastlake: | 50.2 |
| Mayfield Heights: | 26.7 |
| Highland Heights: | 34.7 |
 The median response time based on all reported fire incidents is 7 minutes. This is about the same as the Ohio median value.
The median response time in Chardon, OH compared to nearest cities:
(Note: Based on data for all years, including only cities with at least 500 fire incidents)
| Chardon: | 7 minutes |
| Kirtland: | 6 minutes |
| Chesterland: | 7 minutes |
| Burton: | 9 minutes |
| Painesville: | 5 minutes |
| Middlefield: | 8 minutes |
| Mentor: | 6 minutes |
| Willoughby: | 4 minutes |
| Willoughby Hills: | 7 minutes |
 According to the reports from the years 2002 - 2018 the average number of fire-related yearly casualties is 1. The highest number of reported casualties - 2 took place in 2004, and the lowest - 0 in 2002. The data has a growing trend.
The average number of injuries per 1,000 fires is 9. This indicator was the highest - 33 in 2005, and the lowest 0 in 2002. The trend for injuries per 1,000 incidents is rising. Compared to the Ohio value the number of injuries per 1,000 incidents is lower.
According to the reports from the years 2002 - 2018 the average number of fire-related yearly casualties is 1. The highest number of reported casualties - 2 took place in 2004, and the lowest - 0 in 2002. The data has a growing trend.
The average number of injuries per 1,000 fires is 9. This indicator was the highest - 33 in 2005, and the lowest 0 in 2002. The trend for injuries per 1,000 incidents is rising. Compared to the Ohio value the number of injuries per 1,000 incidents is lower.Casualties per 1,000 incidents in Chardon, OH compared to nearest cities:
(Note: Based on data for all years, including only cities with at least 500 fire incidents)
| Chardon: | 8.2 |
| Kirtland: | 3.4 |
| Chesterland: | 0.0 |
| Burton: | 2.5 |
| Painesville: | 36.8 |
| Middlefield: | 10.8 |
| Mentor: | 20.3 |
| Willoughby: | 41.4 |
| Willoughby Hills: | 14.3 |
 34.0% incidents where reported in the morning and 66.0% in the evening. The most fires (16.8%) took place on Saturday, and the least (12.6%) on Wednesday.
 According to the 1,468 incident reports from years 2002 - 2018 most fires (11.6%) took place during April, and the least (5.7%) in September.
 Out of all 14,382 cases reported during the years 2002 - 2018, the most belonged to the categories: Rescue & EMS (57.0%), Hazardous Condition (12.1%), and Fire (10.2%).
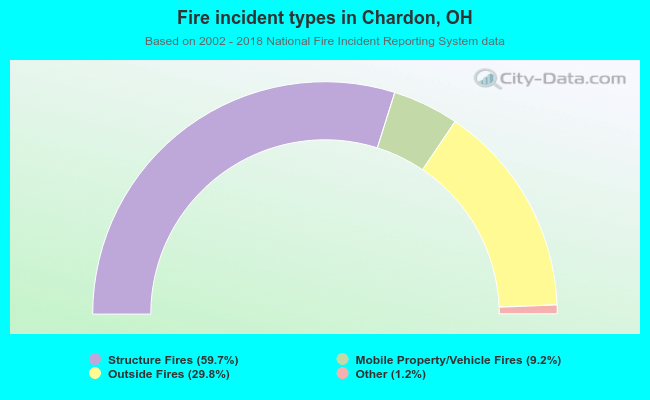 When looking into fire subcategories, the most incidents belonged to: Structure Fires (59.7%), and Outside Fires (29.8%).