Chester: Fire Incidents, Pennsylvania (PA)
Where are fire incidents reported in Chester, PA
Something went wrong! Please refresh the page.
| Fire incidents reported | |
|---|---|
| Sreet name | Count |
| ARBOR DR | 692 |
| NINTH ST | 364 |
| MADISON ST | 272 |
| THIRD ST | 258 |
| SEVENTH ST | 228 |
| TWENTY FOURTH ST | 210 |
| TWENTY THIRD ST | 148 |
| ARBOR DR. | 138 |
| KERLIN ST | 124 |
| TENTH ST | 114 |
| TWENTY SECOND ST | 110 |
| ARBOR | 100 |
| SECOND ST | 100 |
| SIXTH ST | 98 |
| EIGHTH ST | 94 |
| HIGHLAND AVE | 94 |
| AVENUE OF THE STATES AOS | 88 |
| TWENTY FIRST ST | 82 |
| FIFTH ST | 80 |
| FOURTH ST | 74 |
| UPLAND ST | 74 |
| ELEVENTH ST | 70 |
| PROVIDENCE AVE | 70 |
| EDGMONT AVE | 66 |
| WARD ST | 66 |
| FRONT ST | 64 |
| PARKER ST | 64 |
| RAINER RD | 64 |
| AVENUE OF THE STATES | 58 |
| FIFTEENTH ST | 58 |
| Other | 561 |
2003 - 2018 National Fire Incident Reporting System (NFIRS) incidents
- Incident types reported to NFIRS in Chester, PA
- 4,68336.6%Fire
- 3,09624.2%Hazardous Condition
- 2,48919.4%False Alarm
- 1,32310.3%Rescue & EMS
- 6284.9%Service Call
- 5094.0%Good Intent Call
- 340.3%Overpressure Rupture
- 290.2%Special Incident
- Fire incident types reported to NFIRS in Chester, PA
- 3,23769.1%Structure Fires
- 70715.1%Outside Fires
- 59312.7%Mobile Property/Vehicle Fires
- 1463.1%Other
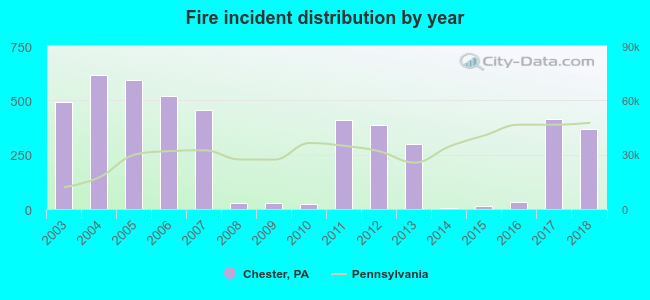 According to the data from the years 2003 - 2018 the average number of fires per year is 293. The highest number of reported fires - 617 took place in 2004, and the least - 4 in 2014. The data has a declining trend.
The average number of yearly fire incidents per 10k residents in Chester, PA compared to nearest cities:
(Note: Based on data for the last 3 years, including only cities with population 5,000 and above)
| Chester: | 79.4 |
| Brookhaven: | 79.3 |
| Woodlyn: | 9.5 |
| Ridley Park: | 72.5 |
| Folsom: | 28.4 |
| Swarthmore: | 52.1 |
| Prospect Park: | 31.9 |
| Norwood: | 35.0 |
| Media: | 151.6 |
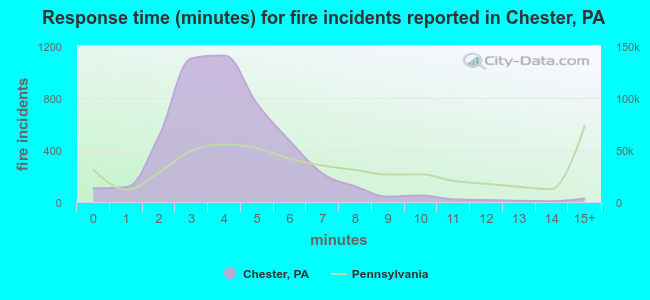 The median response time based on all reported fire incidents is 4 minutes. This is lower compared to the state median value.
The median response time in Chester, PA compared to nearest cities:
(Note: Based on data for all years, including only cities with at least 500 fire incidents)
| Chester: | 4 minutes |
| Brookhaven: | 3 minutes |
| Media: | 6 minutes |
| Claymont: | 6 minutes |
| Collingdale: | 4 minutes |
| Paulsboro: | 8 minutes |
| Darby: | 5 minutes |
| Broomall: | 6 minutes |
| Yeadon: | 5 minutes |
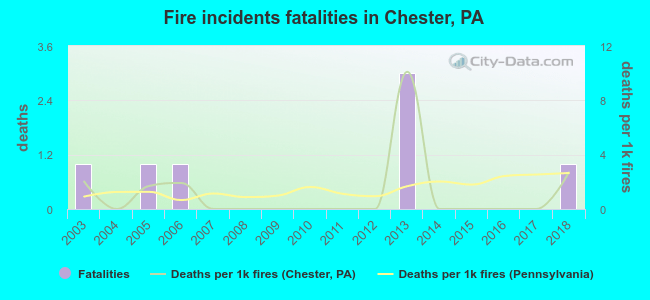 According to the reports from the years 2003 - 2018 the average number of fire-related yearly deaths is 0. The highest number of deaths - 3 took place in 2013, and the lowest - 0 in 2004. The data has a constant trend.
The average number of fatalities per 1,000 fires is 1. This indicator was the highest - 10 in 2013, and the lowest 0 in 2004. The trend for fatalities per 1,000 fire incidents is growing. Compared to the state value the number of fatalities per 1,000 fire incidents is similar.
According to the reports from the years 2003 - 2018 the average number of fire-related yearly deaths is 0. The highest number of deaths - 3 took place in 2013, and the lowest - 0 in 2004. The data has a constant trend.
The average number of fatalities per 1,000 fires is 1. This indicator was the highest - 10 in 2013, and the lowest 0 in 2004. The trend for fatalities per 1,000 fire incidents is growing. Compared to the state value the number of fatalities per 1,000 fire incidents is similar.Deaths per 1,000 incidents in Chester, PA compared to nearest cities:
(Note: Based on data for all years, including only cities with at least 2,500 fire incidents)
| Chester: | 1.5 |
| Wilmington: | 0.6 |
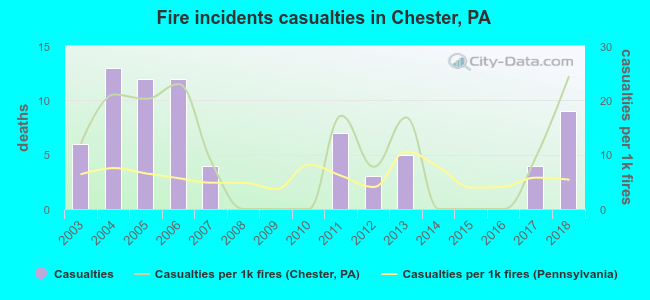 According to the data from the years 2003 - 2018 the average number of fire-related casualties per year is 5. The highest number of injuries - 13 took place in 2004, and the lowest - 0 in 2008. The data has a growing trend.
The average number of casualties per 1,000 fires is 10. This indicator was the highest - 24 in 2018, and the lowest 0 in 2008. The trend for casualties per 1,000 fires is increasing. Compared to the Pennsylvania value the number of casualties per 1,000 incidents is much higher.
According to the data from the years 2003 - 2018 the average number of fire-related casualties per year is 5. The highest number of injuries - 13 took place in 2004, and the lowest - 0 in 2008. The data has a growing trend.
The average number of casualties per 1,000 fires is 10. This indicator was the highest - 24 in 2018, and the lowest 0 in 2008. The trend for casualties per 1,000 fires is increasing. Compared to the Pennsylvania value the number of casualties per 1,000 incidents is much higher.Casualties per 1,000 incidents in Chester, PA compared to nearest cities:
(Note: Based on data for all years, including only cities with at least 500 fire incidents)
| Chester: | 16.0 |
| Brookhaven: | 4.0 |
| Media: | 0.0 |
| Claymont: | 6.4 |
| Collingdale: | 1.5 |
| Paulsboro: | 0.0 |
| Darby: | 0.0 |
| Broomall: | 5.7 |
| Yeadon: | 1.2 |
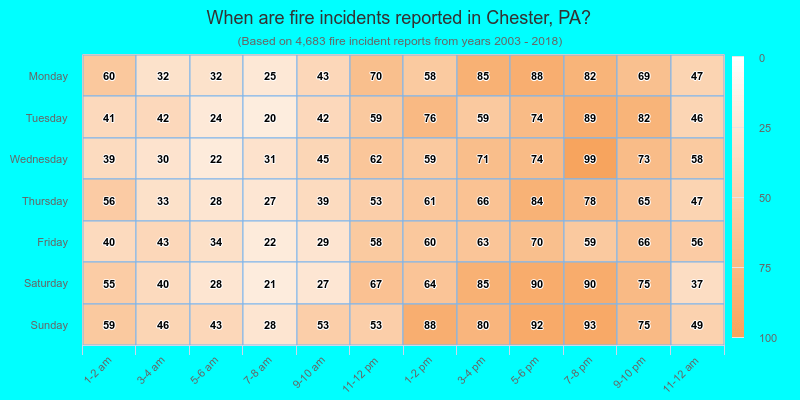
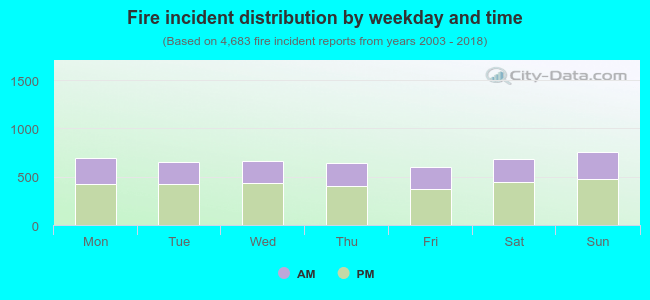 36.3% incidents where reported in the morning and 63.7% in the evening. The most fires (16.2%) took place on Sunday, and the least (12.8%) on Friday.
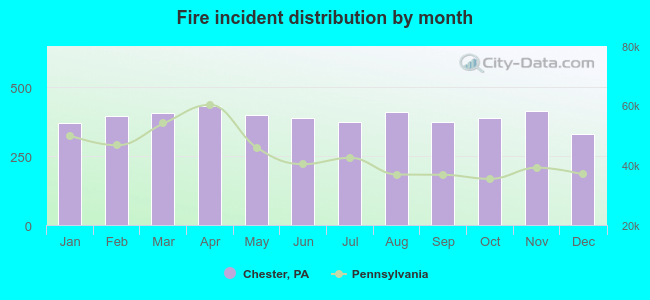 According to the 4,683 fire incident reports from years 2003 - 2018 most fires (9.2%) took place during April, and the least (7.0%) in December.
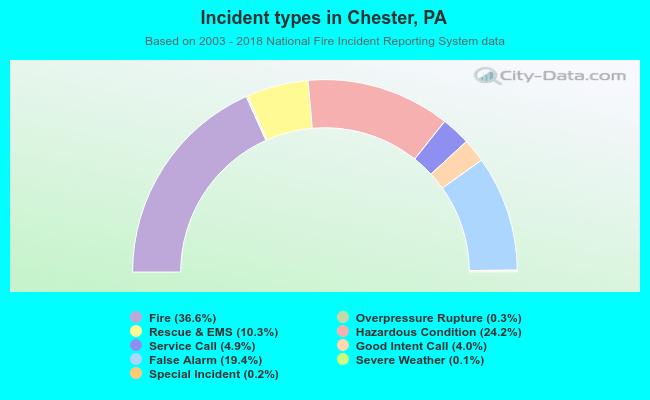 Out of all 12,800 cases reported during the years 2003 - 2018, the most belonged to the categories: Fire (36.6%), Hazardous Condition (24.2%), and False Alarm (19.4%).
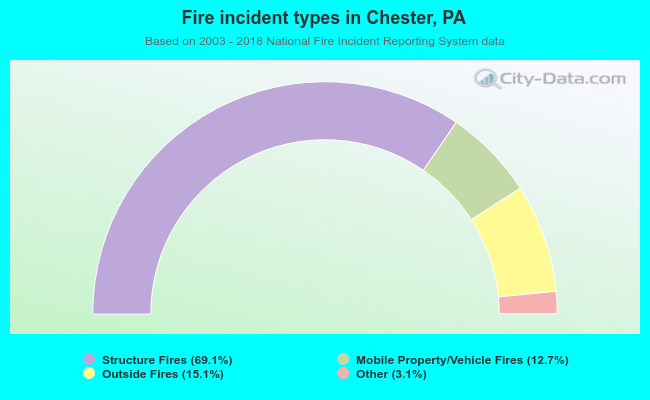 When looking into fire subcategories, the most reports belonged to: Structure Fires (69.1%), and Outside Fires (15.1%).