Chestnut Ridge: Fire Incidents, New York (NY)
Where are fire incidents reported in Chestnut Ridge, NY
Something went wrong! Please refresh the page.
|
| |||||||||||||||||||||||||||||||||||||||||||||||||||||||||||||||||||||||||||||||||||||||||||||||||||||||||||||
2003 - 2018 National Fire Incident Reporting System (NFIRS) incidents
- Incident types reported to NFIRS in Chestnut Ridge, NY
- 49133.6%Hazardous Condition
- 30821.1%False Alarm
- 28219.3%Good Intent Call
- 23115.8%Fire
- 966.6%Service Call
- 392.7%Rescue & EMS
- 100.7%Severe Weather
- 30.2%Overpressure Rupture
- Fire incident types reported to NFIRS in Chestnut Ridge, NY
- 16671.9%Structure Fires
- 3916.9%Outside Fires
- 146.1%Other
- 125.2%Mobile Property/Vehicle Fires
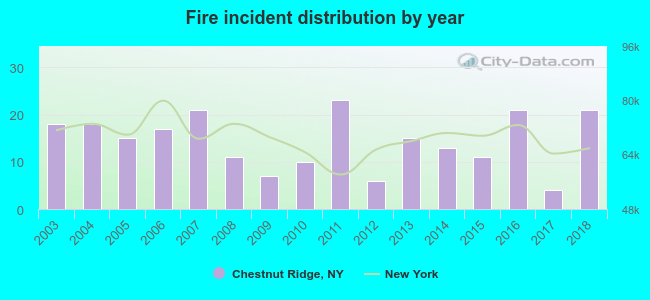 Based on the data from the years 2003 - 2018 the average number of fires per year is 14. The highest number of reported fires - 23 took place in 2011, and the least - 4 in 2017. The data has a rising trend.
The average number of yearly fire incidents per 10k residents in Chestnut Ridge, NY compared to nearest cities:
(Note: Based on data for the last 3 years, including only cities with population 5,000 and above)
| Chestnut Ridge: | 18.8 |
| Nanuet: | 24.0 |
| Spring Valley: | 13.7 |
| Pearl River: | 18.3 |
| Monsey: | 31.5 |
| Airmont: | 33.4 |
| Kaser: | 16.0 |
| Hillcrest: | 7.5 |
| Viola: | 23.8 |
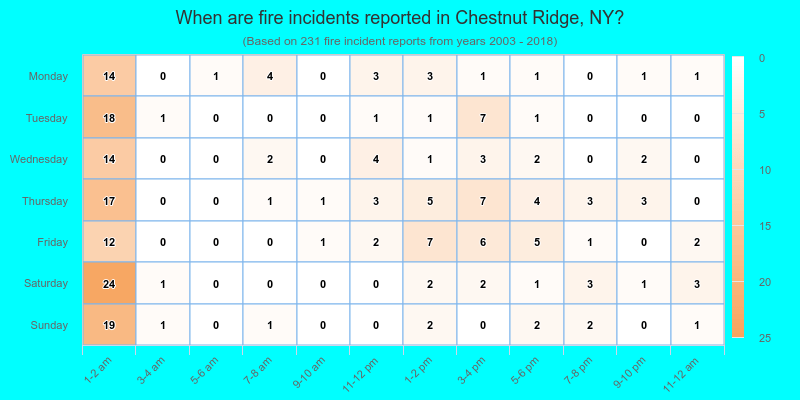
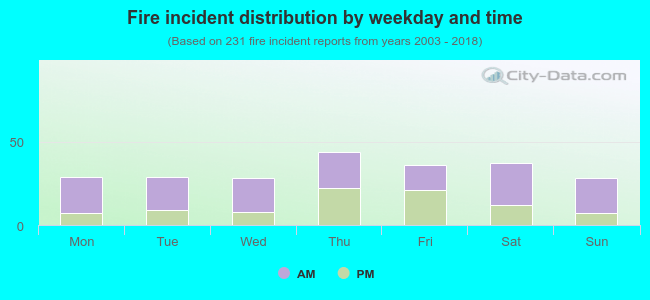 62.8% incidents where reported in the morning and 37.2% in the evening. The most fires (19.0%) took place on Thursday, and the least (12.1%) on Wednesday.
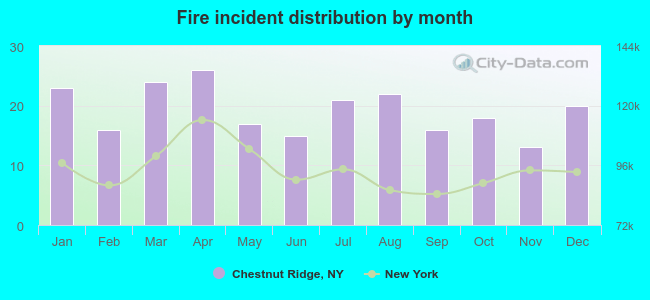 According to the 231 fire incident reports from years 2003 - 2018 most fires (11.3%) took place during April, and the least (5.6%) in November.
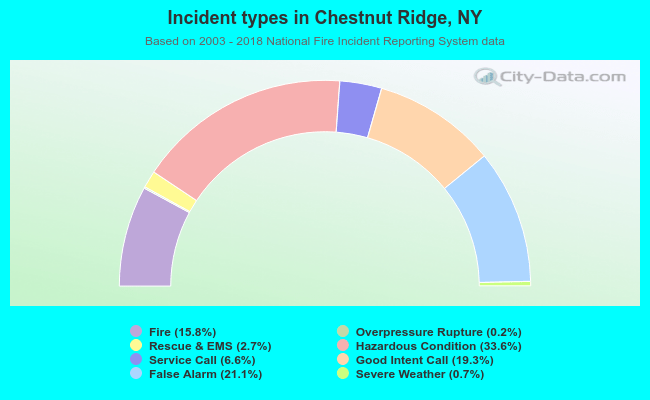 Out of all 1,460 cases reported during the years 2003 - 2018, the most belonged to the categories: Hazardous Condition (33.6%), False Alarm (21.1%), and Good Intent Call (19.3%).
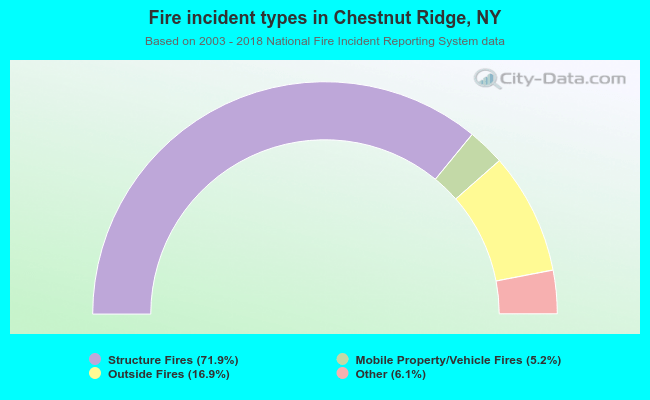 When looking into fire subcategories, the most incidents belonged to: Structure Fires (71.9%), and Outside Fires (16.9%).