Pearl River: Fire Incidents, New York (NY)
Where are fire incidents reported in Pearl River, NY
Something went wrong! Please refresh the page.
|
| |||||||||||||||||||||||||||||||||||||||||||||||||||||||||||||||||||||||||||||||||||||||||||||||||||||||||||||
| Other | 107 | |||||||||||||||||||||||||||||||||||||||||||||||||||||||||||||||||||||||||||||||||||||||||||||||||||||||||||||
2003 - 2018 National Fire Incident Reporting System (NFIRS) incidents
- Incident types reported to NFIRS in Pearl River, NY
- 56127.4%Fire
- 54126.4%Hazardous Condition
- 50524.7%False Alarm
- 24011.7%Good Intent Call
- 1507.3%Service Call
- 412.0%Rescue & EMS
- 90.4%Severe Weather
- Fire incident types reported to NFIRS in Pearl River, NY
- 29552.6%Structure Fires
- 15327.3%Outside Fires
- 5910.5%Other
- 549.6%Mobile Property/Vehicle Fires
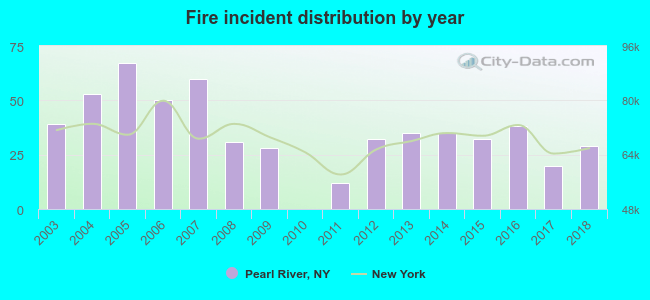 Based on the data from the years 2003 - 2018 the average number of fires per year is 35. The highest number of reported fire incidents - 67 took place in 2005, and the least - 0 in 2010. The data has a declining trend.
The average number of yearly fire incidents per 10k residents in Pearl River, NY compared to nearest cities:
(Note: Based on data for the last 3 years, including only cities with population 5,000 and above)
| Pearl River: | 18.3 |
| Nanuet: | 24.0 |
| Chestnut Ridge: | 18.8 |
| Blauvelt: | 24.6 |
| Spring Valley: | 13.7 |
| Tappan: | 32.3 |
| Hillcrest: | 7.5 |
| Monsey: | 31.5 |
| Kaser: | 16.0 |
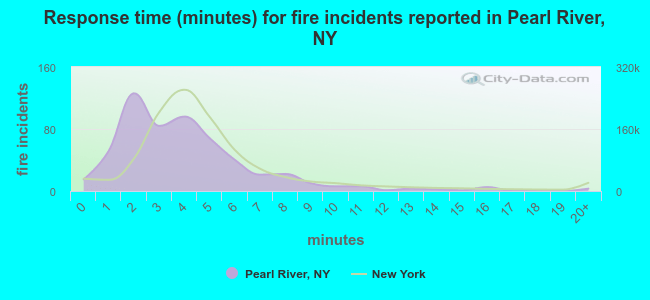 The median response time based on all reported fire incidents is 4 minutes. This is about the same as the state median value.
The median response time in Pearl River, NY compared to nearest cities:
(Note: Based on data for all years, including only cities with at least 500 fire incidents)
| Pearl River: | 4 minutes |
| Nanuet: | 5 minutes |
| Orangeburg: | 3 minutes |
| Spring Valley: | 5 minutes |
| Monsey: | 0 minutes |
| Airmont: | 4 minutes |
| New City: | 4 minutes |
| Ramsey: | 7 minutes |
| Ridgewood: | 3 minutes |
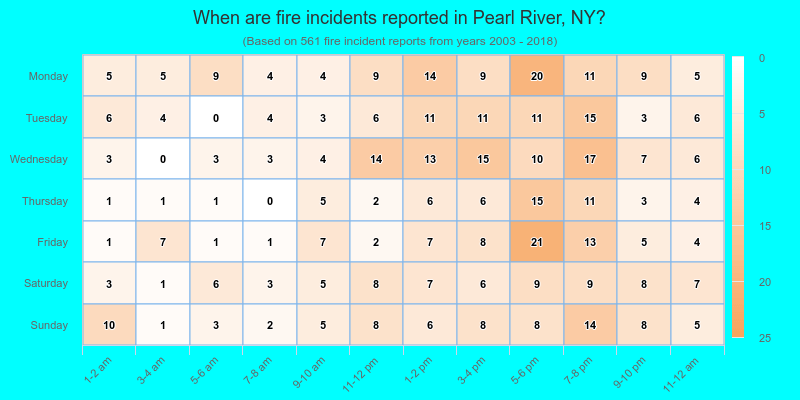
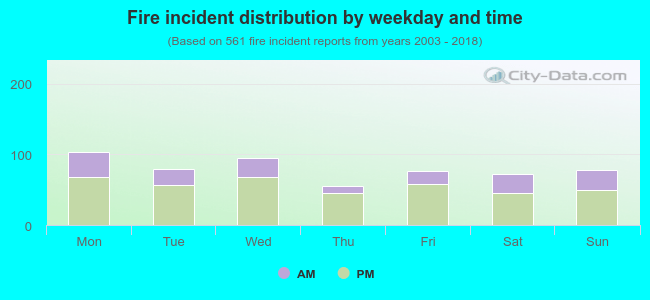 30.3% incidents where reported in the morning and 69.7% in the evening. The most fires (18.5%) took place on Monday, and the least (9.8%) on Thursday.
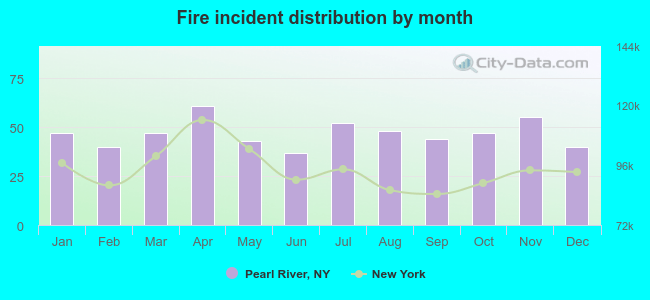 According to the 561 fire incidents from years 2003 - 2018 most fires (10.9%) took place during April, and the least (6.6%) in June.
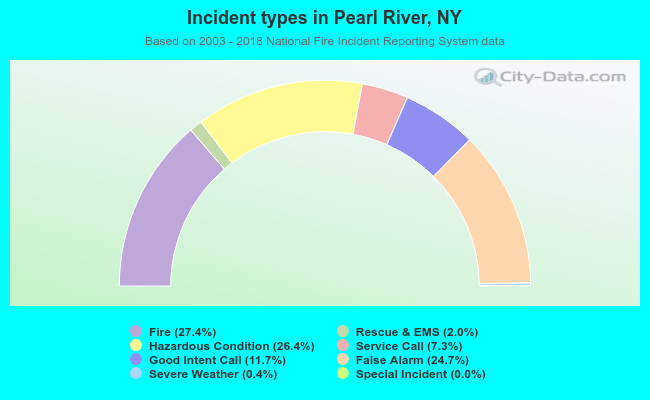 Out of all 2,048 cases reported during the years 2003 - 2018, the most belonged to the categories: Fire (27.4%), Rescue & EMS (26.4%), and Good Intent Call (24.7%).
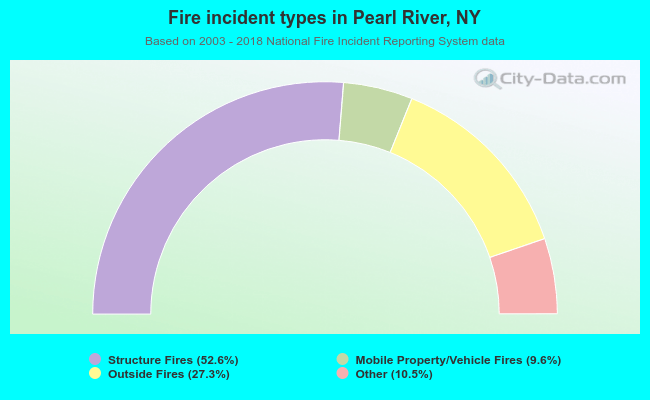 When looking into fire subcategories, the most reports belonged to: Structure Fires (52.6%), and Outside Fires (27.3%).