Nanuet: Fire Incidents, New York (NY)
Where are fire incidents reported in Nanuet, NY
Something went wrong! Please refresh the page.
|
| |||||||||||||||||||||||||||||||||||||||||||||||||||||||||||||||||||||||||||||||||||||||||||||||||||||||||||||
2002 - 2018 National Fire Incident Reporting System (NFIRS) incidents
- Incident types reported to NFIRS in Nanuet, NY
- 1,63430.5%False Alarm
- 1,34125.0%Fire
- 1,30224.3%Hazardous Condition
- 68012.7%Good Intent Call
- 2865.3%Service Call
- 931.7%Rescue & EMS
- 170.3%Severe Weather
- 60.1%Overpressure Rupture
- Fire incident types reported to NFIRS in Nanuet, NY
- 56141.8%Outside Fires
- 55741.5%Structure Fires
- 19814.8%Mobile Property/Vehicle Fires
- 251.9%Other
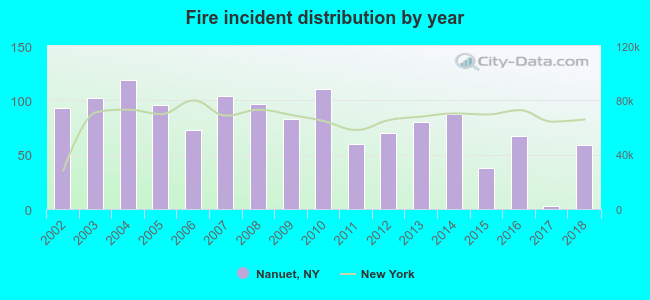 According to the data from the years 2002 - 2018 the average number of fire incidents per year is 79. The highest number of reported fires - 119 took place in 2004, and the least - 3 in 2017. The data has a decreasing trend.
The average number of yearly fire incidents per 10k residents in Nanuet, NY compared to nearest cities:
(Note: Based on data for the last 3 years, including only cities with population 5,000 and above)
| Nanuet: | 24.0 |
| Chestnut Ridge: | 18.8 |
| Spring Valley: | 13.7 |
| Pearl River: | 18.3 |
| Hillcrest: | 7.5 |
| Monsey: | 31.5 |
| New Square: | 16.5 |
| Kaser: | 16.0 |
| New City: | 19.5 |
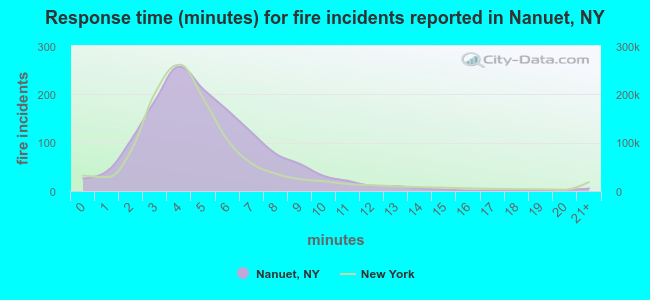 The median response time based on all reported fire incidents is 5 minutes. This is higher than the state median value.
The median response time in Nanuet, NY compared to nearest cities:
(Note: Based on data for all years, including only cities with at least 500 fire incidents)
| Nanuet: | 5 minutes |
| Spring Valley: | 5 minutes |
| Pearl River: | 4 minutes |
| Monsey: | 0 minutes |
| New City: | 4 minutes |
| Airmont: | 4 minutes |
| Orangeburg: | 3 minutes |
| Pomona: | 5 minutes |
| Suffern: | 3 minutes |
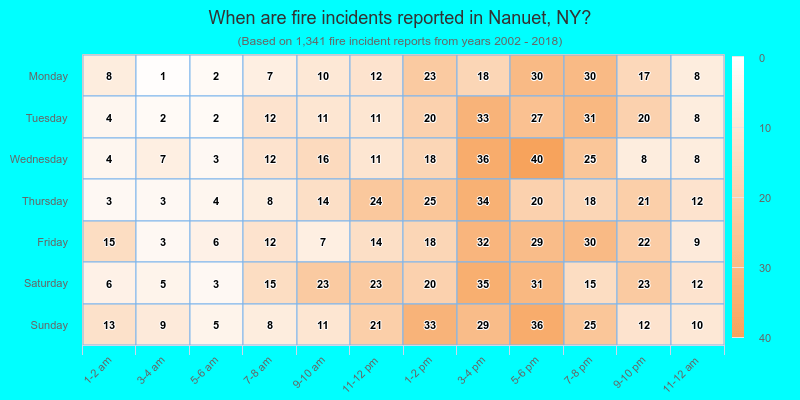
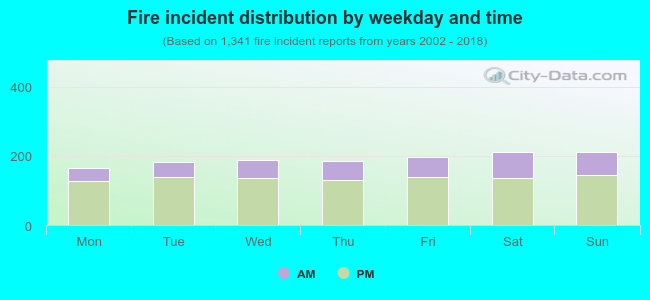 29.1% incidents where reported in the morning and 70.9% in the evening. The most fires (15.8%) took place on Sunday, and the least (12.4%) on Monday.
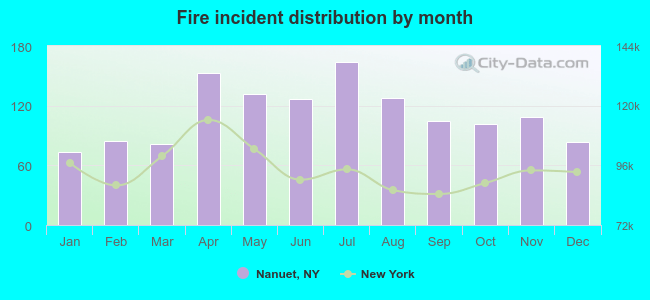 Based on the 1,341 fire incident reports from years 2002 - 2018 most fires (12.2%) took place during July, and the least (5.4%) in January.
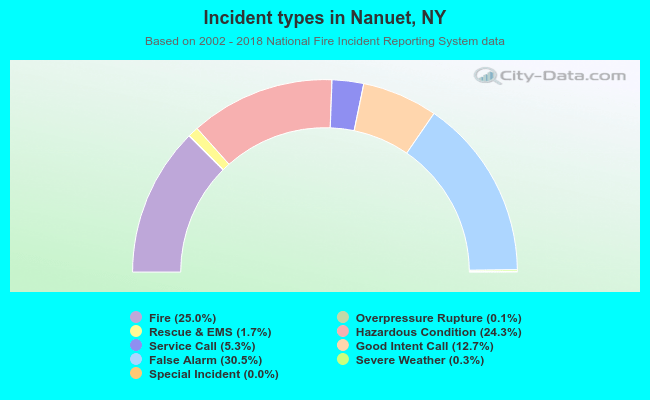 Out of all 5,360 cases reported during the years 2002 - 2018, the most belonged to the categories: False Alarm (30.5%), Fire (25.0%), and Hazardous Condition (24.3%).
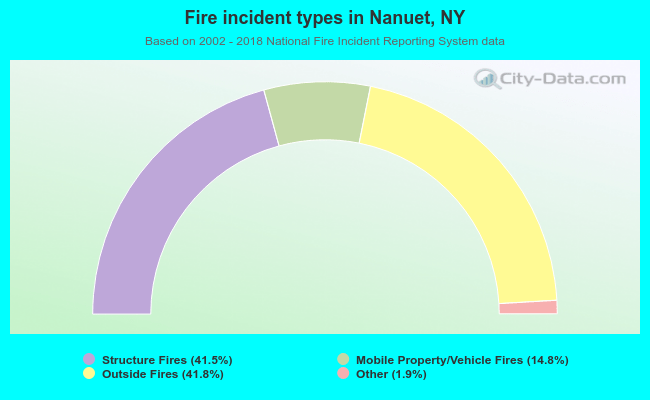 When looking into fire subcategories, the most reports belonged to: Outside Fires (41.8%), and Structure Fires (41.5%).