Childersburg: Fire Incidents, Alabama (AL)
Where are fire incidents reported in Childersburg, AL
Something went wrong! Please refresh the page.
|
| |||||||||||||||||||||||||||||||||||||||||||||||||||||||||||||||||||||||||||||||||||||||||||||||||||||||||||||
2002 - 2018 National Fire Incident Reporting System (NFIRS) incidents
- Incident types reported to NFIRS in Childersburg, AL
- 1,41580.8%Rescue & EMS
- 20311.6%Fire
- 452.6%Hazardous Condition
- 412.3%False Alarm
- 211.2%Service Call
- 211.2%Good Intent Call
- 20.1%Severe Weather
- 20.1%Special Incident
- Fire incident types reported to NFIRS in Childersburg, AL
- 7737.9%Structure Fires
- 5225.6%Outside Fires
- 4823.6%Other
- 2612.8%Mobile Property/Vehicle Fires
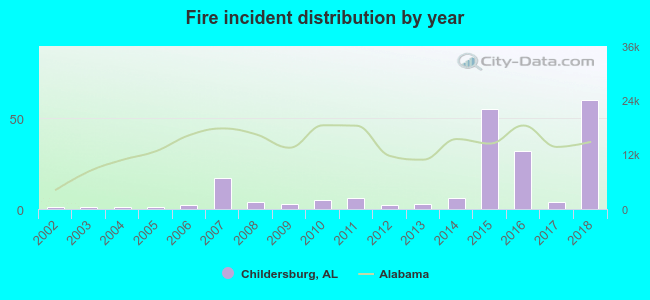 According to the data from the years 2002 - 2018 the average number of fires per year is 12. The highest number of reported fire incidents - 60 took place in 2018, and the least - 1 in 2002. The data has a growing trend.
The average number of yearly fire incidents per 10k residents in Childersburg, AL compared to nearest cities:
(Note: Based on data for the last 3 years, including only cities with population 5,000 and above)
| Childersburg: | 63.1 |
| Sylacauga: | 116.8 |
| Chelsea: | 40.3 |
| Talladega: | 68.3 |
| Pell City: | 19.2 |
| Leeds: | 53.0 |
| Moody: | 36.9 |
| Pelham: | 33.9 |
| Lincoln: | 170.9 |

 31.5% incidents where reported in the morning and 68.5% in the evening. The most fires (20.2%) took place on Wednesday, and the least (10.3%) on Thursday.
 Based on the 203 fire incident reports from years 2002 - 2018 most fires (22.2%) took place during February, and the least (2.5%) in June.
 Out of all 1,751 cases reported during the years 2002 - 2018, the most belonged to the categories: Rescue & EMS (80.8%), Fire (11.6%), and Hazardous Condition (2.6%).
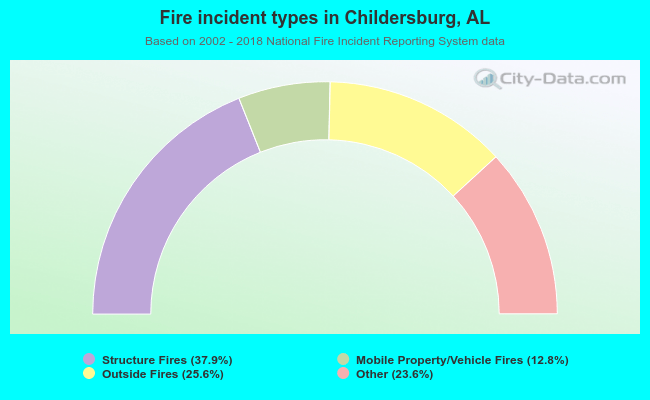 When looking into fire subcategories, the most reports belonged to: Structure Fires (37.9%), and Outside Fires (25.6%).