Pell City: Fire Incidents, Alabama (AL)
Where are fire incidents reported in Pell City, AL
Something went wrong! Please refresh the page.
|
| |||||||||||||||||||||||||||||||||||||||||||||||||||||||||||||||||||||||||||||||||||||||||||||||||||||||||||||
2002 - 2018 National Fire Incident Reporting System (NFIRS) incidents
- Incident types reported to NFIRS in Pell City, AL
- 1,64763.4%Rescue & EMS
- 28410.9%Fire
- 2328.9%Service Call
- 1867.2%Good Intent Call
- 1696.5%False Alarm
- 672.6%Hazardous Condition
- 90.3%Severe Weather
- 30.1%Special Incident
- Fire incident types reported to NFIRS in Pell City, AL
- 13748.2%Outside Fires
- 11440.1%Structure Fires
- 258.8%Mobile Property/Vehicle Fires
- 82.8%Other
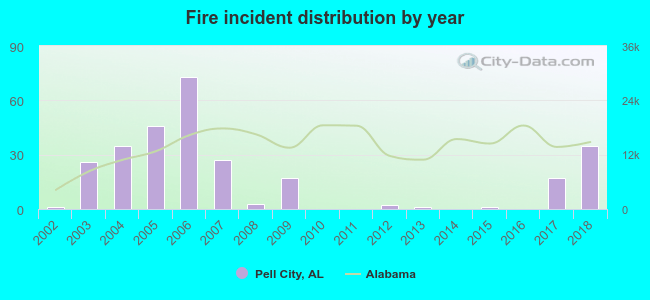 Based on the data from the years 2002 - 2018 the average number of fires per year is 17. The highest number of fires - 73 took place in 2006, and the least - 0 in 2010. The data has a growing trend.
The average number of yearly fire incidents per 10k residents in Pell City, AL compared to nearest cities:
(Note: Based on data for the last 3 years, including only cities with population 5,000 and above)
| Pell City: | 19.2 |
| Lincoln: | 170.9 |
| Moody: | 36.9 |
| Talladega: | 68.3 |
| Leeds: | 53.0 |
| Trussville: | 18.4 |
| Childersburg: | 63.1 |
| Clay: | 5.2 |
| Center Point: | 49.5 |
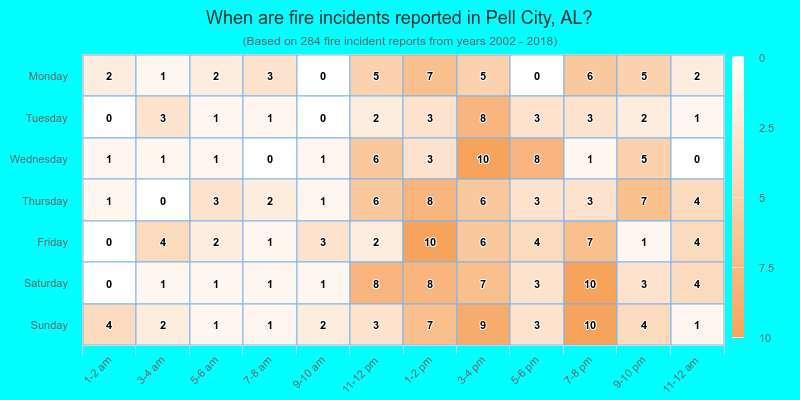
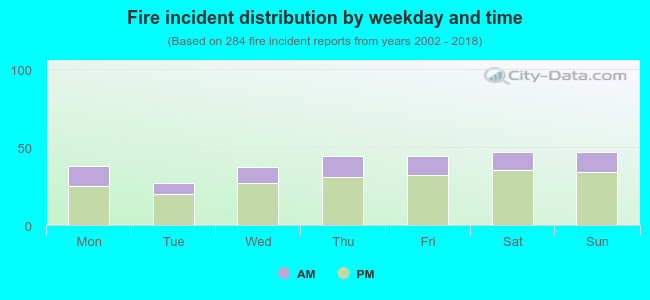 28.2% incidents where reported in the morning and 71.8% in the evening. The most fires (16.5%) took place on Saturday, and the least (9.5%) on Tuesday.
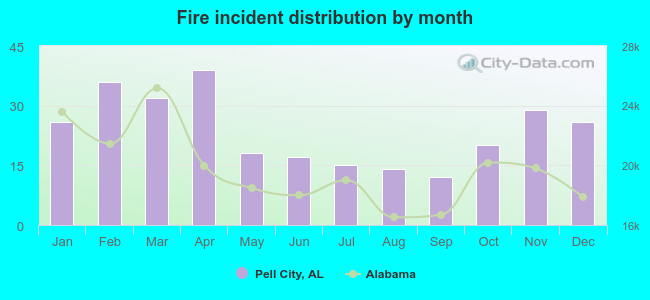 According to the 284 reports from years 2002 - 2018 most fires (13.7%) took place during April, and the least (4.2%) in September.
 Out of all 2,598 cases reported during the years 2002 - 2018, the most belonged to the categories: Rescue & EMS (63.4%), Fire (10.9%), and Service Call (8.9%).
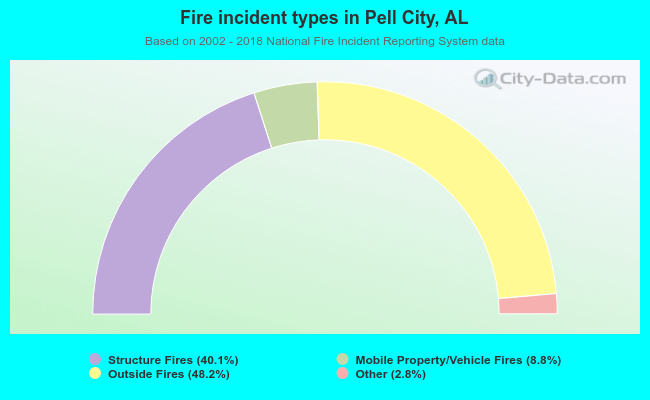 When looking into fire subcategories, the most reports belonged to: Outside Fires (48.2%), and Structure Fires (40.1%).