Greeneville: Fire Incidents, Tennessee (TN)
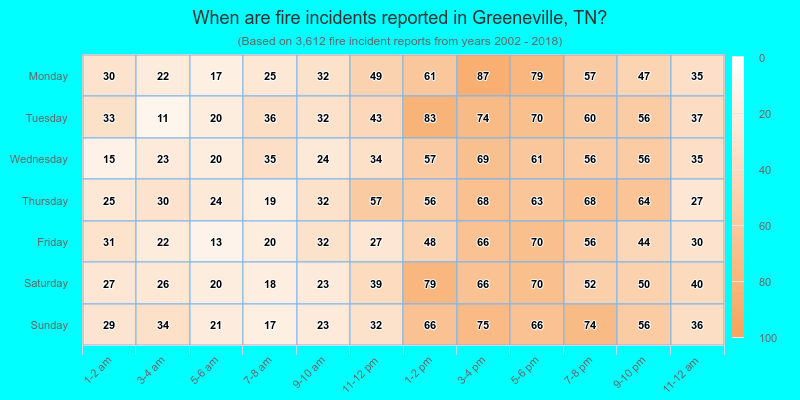
Where are fire incidents reported in Greeneville, TN
Something went wrong! Please refresh the page.
| Fire incidents reported | |
|---|---|
| Sreet name | Count |
| ANDREW JOHNSON HWY | 218 |
| ASHEVILLE HWY | 166 |
| MAIN ST | 122 |
| NEWPORT HWY | 102 |
| TUSCULUM BLVD | 92 |
| OLD STAGE RD | 70 |
| A.J. HWY | 66 |
| SNAPPS FERRY RD | 60 |
| HORTON HWY | 58 |
| VANN RD | 56 |
| WARRENSBURG RD | 52 |
| HOUSTON VALLEY RD | 42 |
| BAILEYTON RD | 40 |
| KINGSPORT HWY | 40 |
| BUCKINGHAM RD | 38 |
| CEDAR CREEK RD | 38 |
| IRISH ST | 38 |
| WHIRLWIND RD | 38 |
| ALLENS BRIDGE RD | 36 |
| LONESOME PINE TRAIL | 36 |
| CHURCH ST | 32 |
| LITTLE MEADOW CREEK RD | 30 |
| MCKEE ST | 30 |
| 107 CUTOFF | 28 |
| BRIGHT HOPE RD | 28 |
| GREYSTONE RD | 28 |
| MIDDLE CREEK RD | 28 |
| DEPOT ST | 26 |
| HARTMAN LN | 26 |
| ERWIN HWY | 24 |
| Other | 1,924 |
2002 - 2018 National Fire Incident Reporting System (NFIRS) incidents
- Incident types reported to NFIRS in Greeneville, TN
- 4,28834.2%Rescue & EMS
- 3,61228.8%Fire
- 2,02616.1%Good Intent Call
- 9907.9%False Alarm
- 8797.0%Hazardous Condition
- 6795.4%Service Call
- 520.4%Special Incident
- 170.1%Overpressure Rupture
- Fire incident types reported to NFIRS in Greeneville, TN
- 1,43839.8%Structure Fires
- 1,38038.2%Outside Fires
- 56515.6%Mobile Property/Vehicle Fires
- 2296.3%Other
 Based on the data from the years 2002 - 2018 the average number of fire incidents per year is 212. The highest number of fire incidents - 309 took place in 2008, and the least - 35 in 2003. The data has an increasing trend.
The average number of yearly fire incidents per 10k residents in Greeneville, TN compared to nearest cities:
(Note: Based on data for the last 3 years, including only cities with population 5,000 and above)
| Greeneville: | 133.0 |
| Telford: | 10.5 |
| Jonesborough: | 178.8 |
| Erwin: | 5.0 |
| Church Hill: | 52.3 |
| Newport: | 185.1 |
| Morristown: | 46.5 |
| Johnson City: | 41.4 |
| Colonial Heights: | 2.2 |
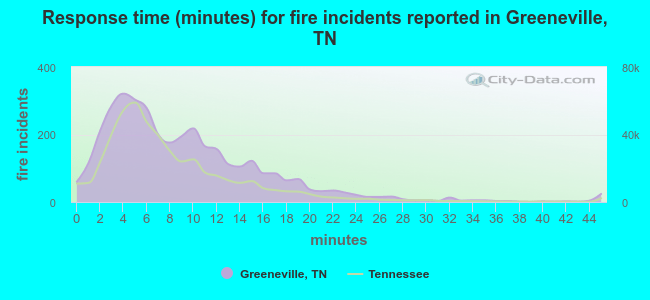 The median response time based on all reported fire incidents is 8 minutes. This is higher compared to the Tennessee median value.
The median response time in Greeneville, TN compared to nearest cities:
(Note: Based on data for all years, including only cities with at least 500 fire incidents)
| Greeneville: | 8 minutes |
| Mosheim: | 9 minutes |
| Parrottsville: | 12 minutes |
| Rogersville: | 10 minutes |
| Jonesborough: | 9 minutes |
| Church Hill: | 9 minutes |
| Newport: | 7 minutes |
| Gray: | 10 minutes |
| Morristown: | 5 minutes |
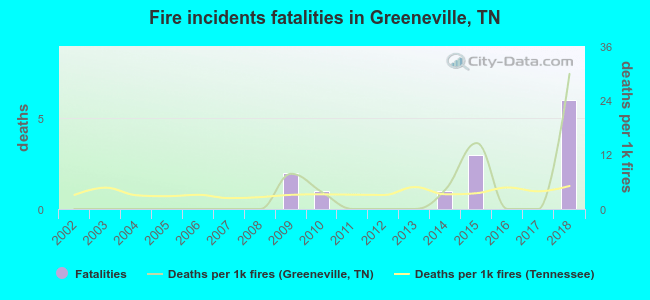 According to the reports from the years 2002 - 2018 the average number of fire-related fatalities per year is 1. The highest number of reported deaths - 6 took place in 2018, and the lowest - 0 in 2002. The data has a growing trend.
The average number of fatalities per 1,000 fire incidents is 4. This indicator was the highest - 30 in 2018, and the lowest 0 in 2002. The trend for deaths per 1,000 incidents is increasing. Compared to the state value the number of fatalities per 1,000 incidents is similar.
According to the reports from the years 2002 - 2018 the average number of fire-related fatalities per year is 1. The highest number of reported deaths - 6 took place in 2018, and the lowest - 0 in 2002. The data has a growing trend.
The average number of fatalities per 1,000 fire incidents is 4. This indicator was the highest - 30 in 2018, and the lowest 0 in 2002. The trend for deaths per 1,000 incidents is increasing. Compared to the state value the number of fatalities per 1,000 incidents is similar.Deaths per 1,000 incidents in Greeneville, TN compared to nearest cities:
(Note: Based on data for all years, including only cities with at least 2,500 fire incidents)
| Greeneville: | 3.6 |
| Morristown: | 4.3 |
| Johnson City: | 4.7 |
| Kingsport: | 3.4 |
| Elizabethton: | 2.2 |
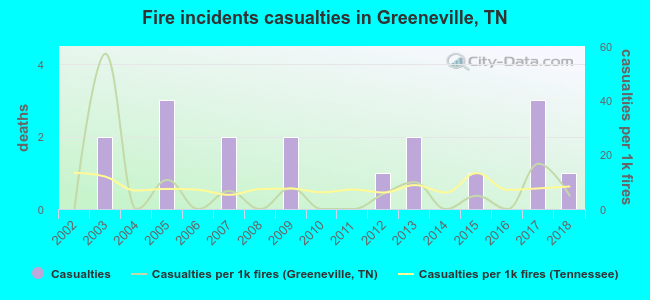 According to the reports from the years 2002 - 2018 the average number of fire-related casualties per year is 1. The highest number of reported casualties - 3 took place in 2005, and the lowest - 0 in 2002. The data has a growing trend.
The average number of casualties per 1,000 fires is 7. This indicator was the highest - 57 in 2003, and the lowest 0 in 2002. The trend for injuries per 1,000 fire incidents is rising. Compared to the Tennessee value the number of injuries per 1,000 incidents is lower.
According to the reports from the years 2002 - 2018 the average number of fire-related casualties per year is 1. The highest number of reported casualties - 3 took place in 2005, and the lowest - 0 in 2002. The data has a growing trend.
The average number of casualties per 1,000 fires is 7. This indicator was the highest - 57 in 2003, and the lowest 0 in 2002. The trend for injuries per 1,000 fire incidents is rising. Compared to the Tennessee value the number of injuries per 1,000 incidents is lower.Casualties per 1,000 incidents in Greeneville, TN compared to nearest cities:
(Note: Based on data for all years, including only cities with at least 500 fire incidents)
| Greeneville: | 4.7 |
| Mosheim: | 0.0 |
| Parrottsville: | 3.6 |
| Rogersville: | 3.1 |
| Jonesborough: | 2.9 |
| Church Hill: | 4.2 |
| Newport: | 0.4 |
| Gray: | 1.6 |
| Morristown: | 9.1 |
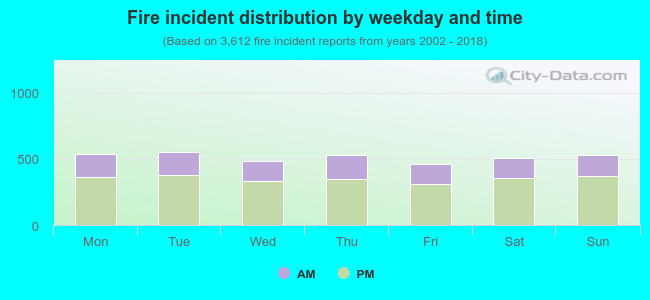 31.6% incidents where reported in the morning and 68.4% in the evening. The most fires (15.4%) took place on Tuesday, and the least (12.7%) on Friday.
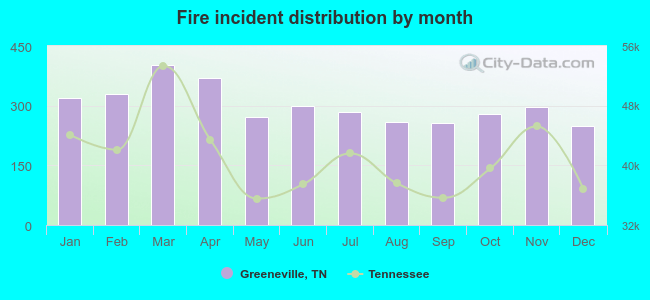 According to the 3,612 incident reports from years 2002 - 2018 most fires (11.1%) took place during March, and the least (6.9%) in December.
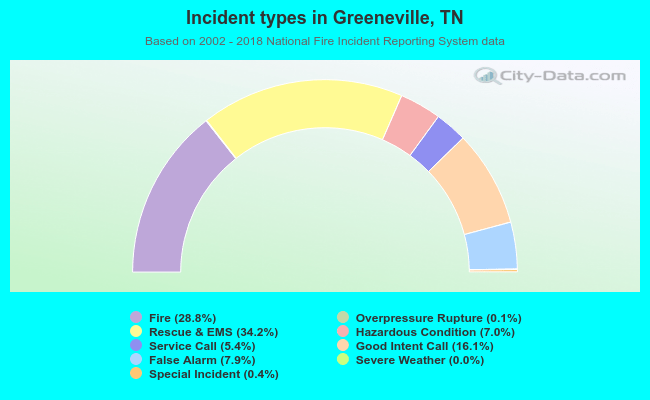 Out of all 12,549 cases reported during the years 2002 - 2018, the most belonged to the categories: Rescue & EMS (34.2%), Fire (28.8%), and Good Intent Call (16.1%).
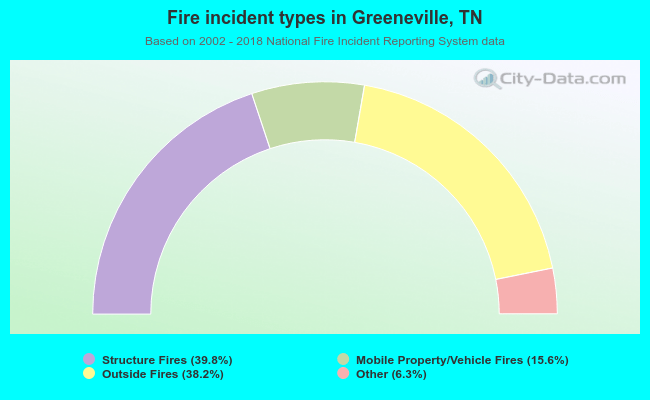 When looking into fire subcategories, the most incidents belonged to: Structure Fires (39.8%), and Outside Fires (38.2%).