Clinton: Fire Incidents, Arkansas (AR)
Where are fire incidents reported in Clinton, AR
Something went wrong! Please refresh the page.
|
| |||||||||||||||||||||||||||||||||||||||||||||||||||||||||||||||||||||||||||||||||||||||||||||||||||||||||||||
| Other | 271 | |||||||||||||||||||||||||||||||||||||||||||||||||||||||||||||||||||||||||||||||||||||||||||||||||||||||||||||
2002 - 2018 National Fire Incident Reporting System (NFIRS) incidents
- Incident types reported to NFIRS in Clinton, AR
- 88561.7%Fire
- 34624.1%Rescue & EMS
- 825.7%Good Intent Call
- 463.2%False Alarm
- 412.9%Hazardous Condition
- 241.7%Service Call
- 50.3%Severe Weather
- 30.2%Overpressure Rupture
- 30.2%Special Incident
- Fire incident types reported to NFIRS in Clinton, AR
- 42648.1%Outside Fires
- 34238.6%Structure Fires
- 10011.3%Mobile Property/Vehicle Fires
- 171.9%Other
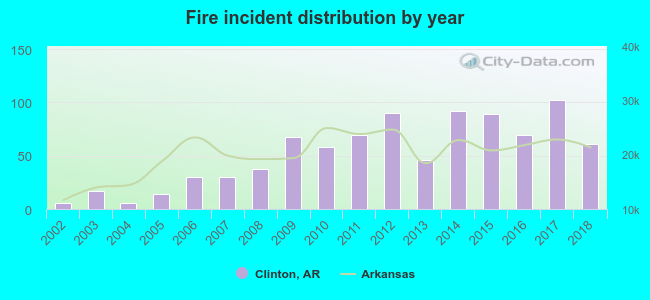 Based on the data from the years 2002 - 2018 the average number of fires per year is 52. The highest number of reported fire incidents - 102 took place in 2017, and the least - 6 in 2002. The data has a growing trend.
 The median response time based on all reported fire incidents is 8 minutes. This is higher compared to the Arkansas median value.
The median response time in Clinton, AR compared to nearest cities:
(Note: Based on data for all years, including only cities with at least 500 fire incidents)
| Clinton: | 8 minutes |
| Heber Springs: | 6 minutes |
| Greenbrier: | 7 minutes |
| Mountain View: | 9 minutes |
| Rose Bud: | 2 minutes |
| Morrilton: | 7 minutes |
| Conway: | 5 minutes |
| Atkins: | 10 minutes |
| Vilonia: | 6 minutes |
 26.9% incidents where reported in the morning and 73.1% in the evening. The most fires (16.8%) took place on Saturday, and the least (9.9%) on Monday.
 Based on the 885 reports from years 2002 - 2018 most fires (16.8%) took place during January, and the least (3.7%) in October.
 Out of all 1,435 cases reported during the years 2002 - 2018, the most belonged to the categories: Fire (61.7%), Rescue & EMS (24.1%), and Good Intent Call (5.7%).
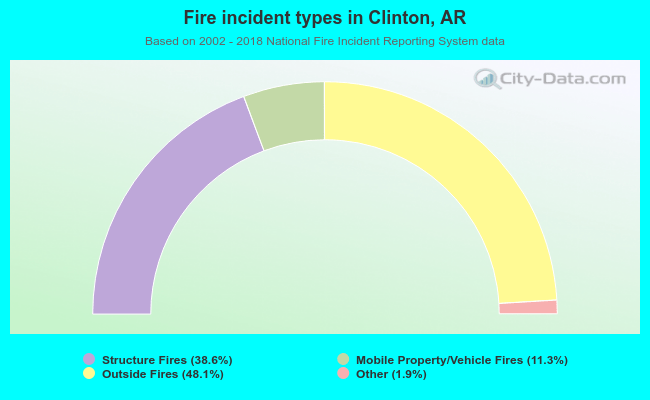 When looking into fire subcategories, the most incidents belonged to: Outside Fires (48.1%), and Structure Fires (38.6%).