Greenbrier: Fire Incidents, Arkansas (AR)
Where are fire incidents reported in Greenbrier, AR
Something went wrong! Please refresh the page.
|
| |||||||||||||||||||||||||||||||||||||||||||||||||||||||||||||||||||||||||||||||||||||||||||||||||||||||||||||
| Other | 190 | |||||||||||||||||||||||||||||||||||||||||||||||||||||||||||||||||||||||||||||||||||||||||||||||||||||||||||||
2007 - 2018 National Fire Incident Reporting System (NFIRS) incidents
- Incident types reported to NFIRS in Greenbrier, AR
- 1,88756.4%Rescue & EMS
- 90427.0%Fire
- 1775.3%Service Call
- 1584.7%Good Intent Call
- 1143.4%Hazardous Condition
- 732.2%False Alarm
- 290.9%Severe Weather
- Fire incident types reported to NFIRS in Greenbrier, AR
- 53258.8%Outside Fires
- 29632.7%Structure Fires
- 657.2%Mobile Property/Vehicle Fires
- 111.2%Other
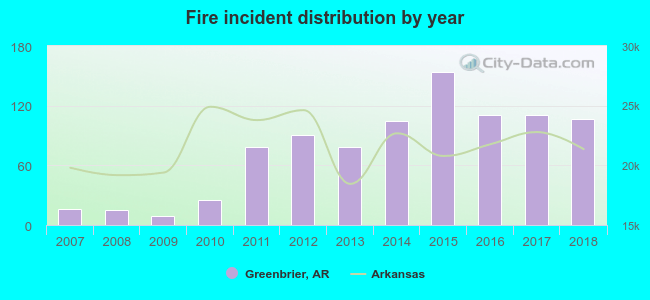 Based on the data from the years 2007 - 2018 the average number of fire incidents per year is 75. The highest number of fires - 154 took place in 2015, and the least - 9 in 2009. The data has a rising trend.
The average number of yearly fire incidents per 10k residents in Greenbrier, AR compared to nearest cities:
(Note: Based on data for the last 3 years, including only cities with population 5,000 and above)
| Greenbrier: | 210.4 |
| Conway: | 51.4 |
| Morrilton: | 87.4 |
| Maumelle: | 23.6 |
| Heber Springs: | 90.1 |
| Cabot: | 64.8 |
| Jacksonville: | 71.7 |
| Sherwood: | 68.3 |
| Beebe: | 171.0 |
 The median response time based on all reported fire incidents is 7 minutes. This is close to the state median value.
The median response time in Greenbrier, AR compared to nearest cities:
(Note: Based on data for all years, including only cities with at least 500 fire incidents)
| Greenbrier: | 7 minutes |
| Conway: | 5 minutes |
| Vilonia: | 6 minutes |
| Mayflower: | 11 minutes |
| Rose Bud: | 2 minutes |
| Morrilton: | 7 minutes |
| Clinton: | 8 minutes |
| Maumelle: | 3 minutes |
| Heber Springs: | 6 minutes |
 25.8% incidents where reported in the morning and 74.2% in the evening. The most fires (17.0%) took place on Saturday, and the least (12.2%) on Sunday.
 According to the 904 fire incidents from years 2007 - 2018 most fires (13.5%) took place during January, and the least (4.9%) in October.
 Out of all 3,347 cases reported during the years 2007 - 2018, the most belonged to the categories: Rescue & EMS (56.4%), Fire (27.0%), and Service Call (5.3%).
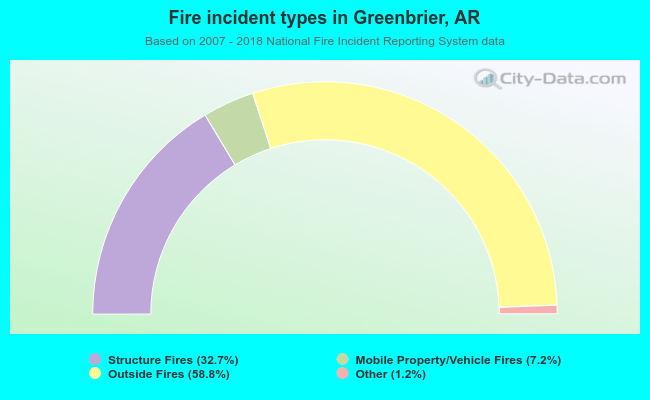 When looking into fire subcategories, the most reports belonged to: Outside Fires (58.8%), and Structure Fires (32.7%).