Morrilton: Fire Incidents, Arkansas (AR)
Where are fire incidents reported in Morrilton, AR
Something went wrong! Please refresh the page.
|
| |||||||||||||||||||||||||||||||||||||||||||||||||||||||||||||||||||||||||||||||||||||||||||||||||||||||||||||
| Other | 314 | |||||||||||||||||||||||||||||||||||||||||||||||||||||||||||||||||||||||||||||||||||||||||||||||||||||||||||||
2003 - 2018 National Fire Incident Reporting System (NFIRS) incidents
- Incident types reported to NFIRS in Morrilton, AR
- 1,42256.9%Fire
- 65626.3%Rescue & EMS
- 1767.0%Good Intent Call
- 1184.7%Hazardous Condition
- 743.0%False Alarm
- 331.3%Service Call
- 140.6%Severe Weather
- 30.1%Overpressure Rupture
- Fire incident types reported to NFIRS in Morrilton, AR
- 71450.2%Outside Fires
- 46232.5%Structure Fires
- 20514.4%Mobile Property/Vehicle Fires
- 412.9%Other
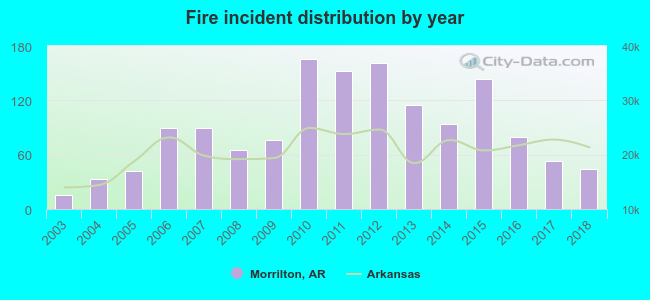 Based on the data from the years 2003 - 2018 the average number of fire incidents per year is 89. The highest number of reported fire incidents - 166 took place in 2010, and the least - 16 in 2003. The data has a rising trend.
The average number of yearly fire incidents per 10k residents in Morrilton, AR compared to nearest cities:
(Note: Based on data for the last 3 years, including only cities with population 5,000 and above)
| Morrilton: | 87.4 |
| Conway: | 51.4 |
| Greenbrier: | 210.4 |
| Russellville: | 78.1 |
| Maumelle: | 23.6 |
| Hot Springs Village: | 27.8 |
| Little Rock: | 80.1 |
| Sherwood: | 68.3 |
| North Little Rock: | 87.9 |
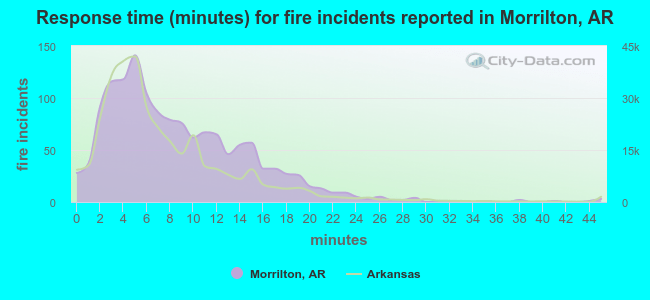 The median response time based on all reported fire incidents is 7 minutes. This is similar to the Arkansas median value.
The median response time in Morrilton, AR compared to nearest cities:
(Note: Based on data for all years, including only cities with at least 500 fire incidents)
| Morrilton: | 7 minutes |
| Perryville: | 8 minutes |
| Atkins: | 10 minutes |
| Conway: | 5 minutes |
| Pottsville: | 9 minutes |
| Greenbrier: | 7 minutes |
| Mayflower: | 11 minutes |
| Russellville: | 5 minutes |
| Dover: | 10 minutes |
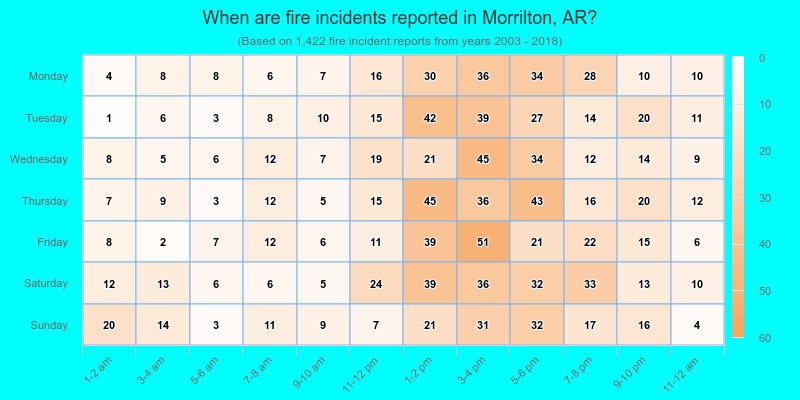
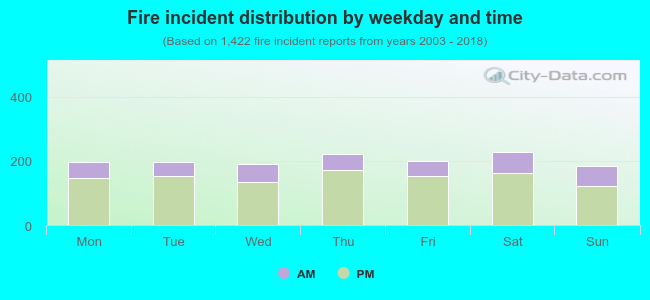 26.4% incidents where reported in the morning and 73.6% in the evening. The most fires (16.1%) took place on Saturday, and the least (13.0%) on Sunday.
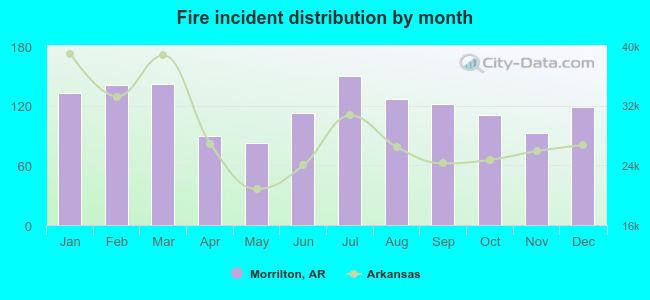 According to the 1,422 reports from years 2003 - 2018 most fires (10.5%) took place during July, and the least (5.8%) in May.
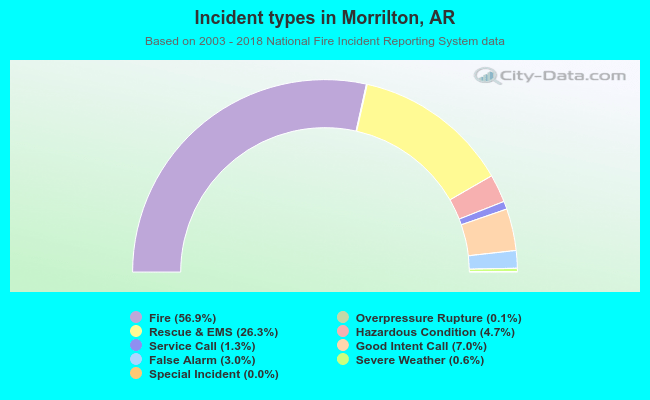 Out of all 2,497 cases reported during the years 2003 - 2018, the most belonged to the categories: Fire (56.9%), Rescue & EMS (26.3%), and Good Intent Call (7.0%).
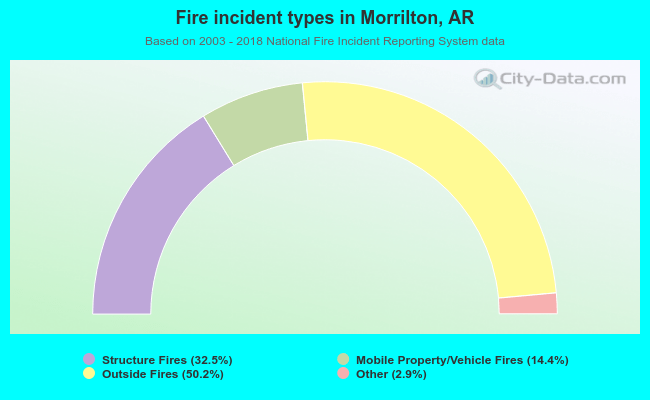 When looking into fire subcategories, the most incidents belonged to: Outside Fires (50.2%), and Structure Fires (32.5%).