Closter: Fire Incidents, New Jersey (NJ)
Where are fire incidents reported in Closter, NJ
Something went wrong! Please refresh the page.
|
| |||||||||||||||||||||||||||||||||||||||||||||||||||||||||||||||||||||||||||||||||||||||||||||||||||||||||||||
2002 - 2018 National Fire Incident Reporting System (NFIRS) incidents
- Incident types reported to NFIRS in Closter, NJ
- 77445.4%False Alarm
- 43225.3%Hazardous Condition
- 23013.5%Fire
- 1116.5%Service Call
- 875.1%Special Incident
- 573.3%Good Intent Call
- 130.8%Rescue & EMS
- Fire incident types reported to NFIRS in Closter, NJ
- 13157.0%Structure Fires
- 3917.0%Outside Fires
- 3716.1%Other
- 2310.0%Mobile Property/Vehicle Fires
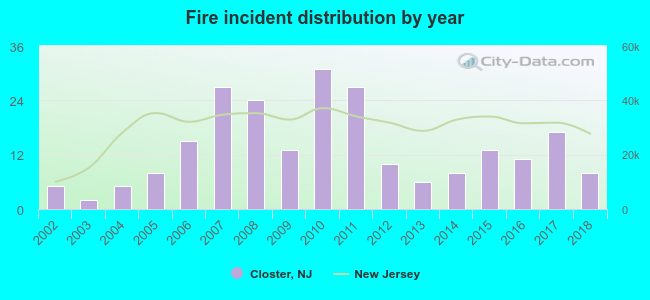 According to the data from the years 2002 - 2018 the average number of fires per year is 14. The highest number of reported fire incidents - 31 took place in 2010, and the least - 2 in 2003. The data has a rising trend.
The average number of yearly fire incidents per 10k residents in Closter, NJ compared to nearest cities:
(Note: Based on data for the last 3 years, including only cities with population 5,000 and above)
| Closter: | 14.0 |
| Norwood: | 14.9 |
| Cresskill: | 9.1 |
| Dumont: | 20.0 |
| Old Tappan: | 13.5 |
| Emerson: | 24.5 |
| Tenafly: | 11.0 |
| Westwood: | 7.2 |
| New Milford: | 8.2 |
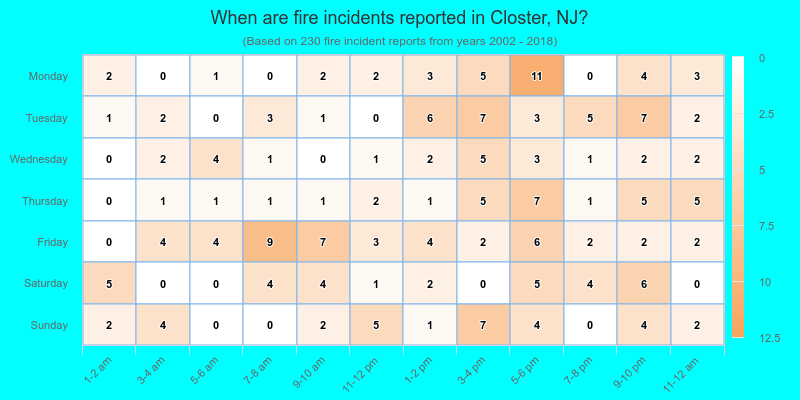
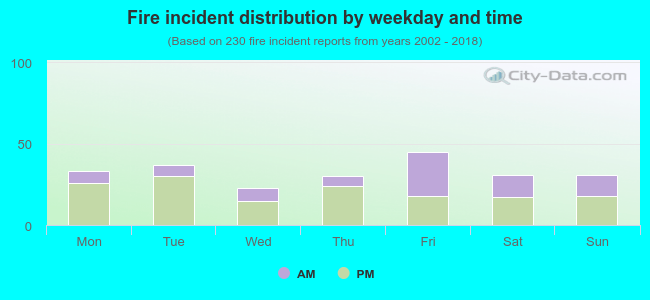 35.7% incidents where reported in the morning and 64.3% in the evening. The most fires (19.6%) took place on Friday, and the least (10.0%) on Wednesday.
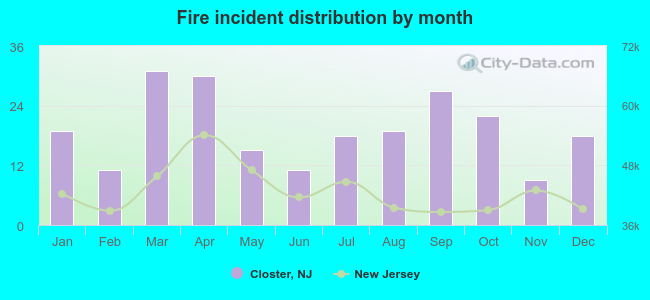 According to the 230 fires from years 2002 - 2018 most fires (13.5%) took place during March, and the least (3.9%) in November.
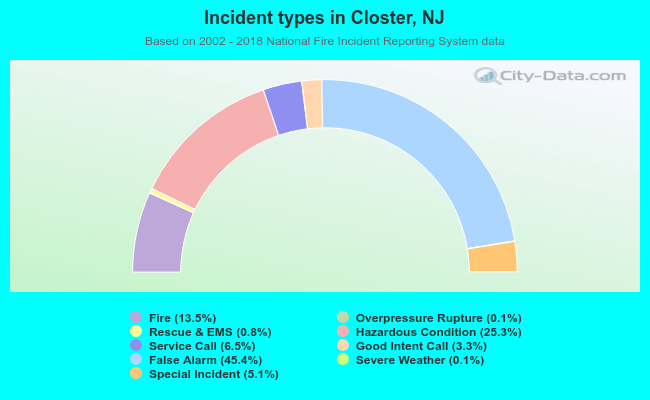 Out of all 1,706 cases reported during the years 2002 - 2018, the most belonged to the categories: False Alarm (45.4%), Hazardous Condition (25.3%), and Fire (13.5%).
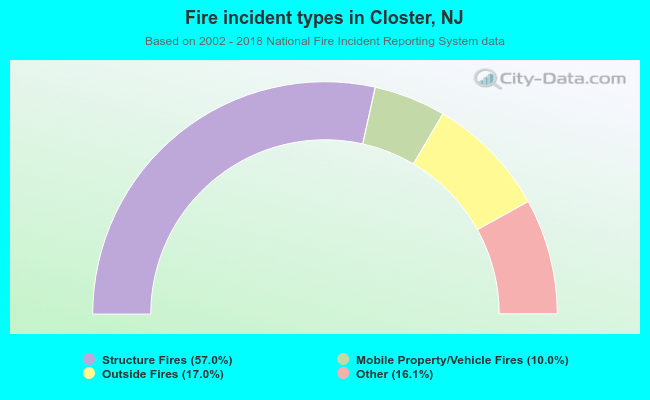 When looking into fire subcategories, the most reports belonged to: Structure Fires (57.0%), and Outside Fires (17.0%).