Albany: Fire Incidents, New York (NY)
Where are fire incidents reported in Albany, NY
Something went wrong! Please refresh the page.
| Fire incidents reported | |
|---|---|
| Sreet name | Count |
| WESTERN AVE | 348 |
| CENTRAL | 326 |
| PEARL ST | 308 |
| CROSSGATES MALL RD | 298 |
| WASHINGTON AV | 268 |
| CENTRAL AV | 246 |
| ALBANY SHAKER ROAD | 226 |
| WASHINGTON | 226 |
| MADISON AV | 100 |
| FIRST ST | 86 |
| STATE ST | 86 |
| CENTRAL AVE | 80 |
| MADISON | 80 |
| THIRD ST | 76 |
| CENTRAL AVENUE AVE | 70 |
| SECOND ST | 68 |
| JOHNSTON RD | 64 |
| ONTARIO ST | 64 |
| WESTERN | 64 |
| BROADWAY | 58 |
| WESTERN AV | 58 |
| GREEN ST | 56 |
| CLINTON AV | 54 |
| MANNING | 54 |
| CENTRAL AVENUE | 52 |
| CHURCH RD | 52 |
| WOODLAKE RD | 52 |
| CLINTON | 50 |
| LARK ST | 50 |
| NEW SCOTLAND | 50 |
| Other | 1,216 |
2002 - 2018 National Fire Incident Reporting System (NFIRS) incidents
- Incident types reported to NFIRS in Albany, NY
- 71,75063.3%Rescue & EMS
- 13,77812.2%False Alarm
- 9,8038.7%Good Intent Call
- 8,0147.1%Hazardous Condition
- 4,8864.3%Fire
- 4,3403.8%Service Call
- 4920.4%Special Incident
- 2010.2%Overpressure Rupture
- Fire incident types reported to NFIRS in Albany, NY
- 2,85958.5%Structure Fires
- 1,10922.7%Outside Fires
- 51110.5%Mobile Property/Vehicle Fires
- 4078.3%Other
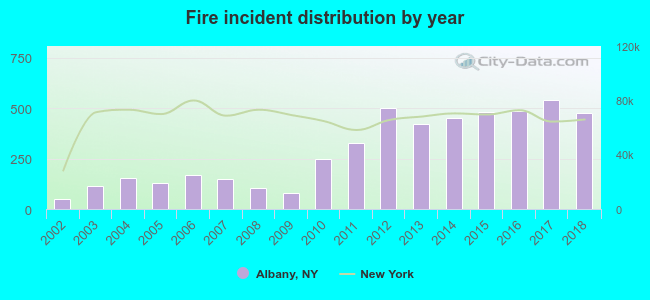 Based on the data from the years 2002 - 2018 the average number of fires per year is 287. The highest number of fires - 539 took place in 2017, and the least - 51 in 2002. The data has a rising trend.
The average number of yearly fire incidents per 10k residents in Albany, NY compared to nearest cities:
(Note: Based on data for the last 3 years, including only cities with population 5,000 and above)
| Albany: | 50.8 |
| Rensselaer: | 136.6 |
| Delmar: | 28.2 |
| Colonie: | 120.5 |
| Watervliet: | 23.5 |
| Troy: | 17.2 |
| Guilderland: | 7.3 |
| Cohoes: | 42.8 |
| Schodack: | 1.6 |
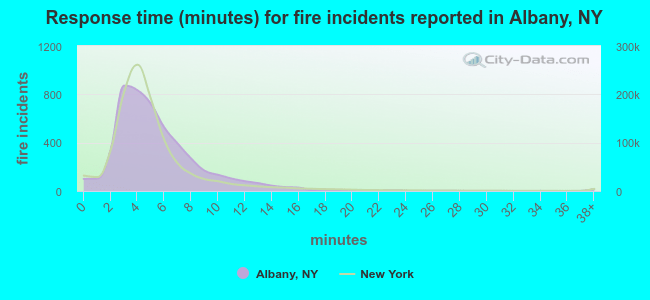 The median response time based on all reported fire incidents is 5 minutes. This is higher compared to the New York median value.
The median response time in Albany, NY compared to nearest cities:
(Note: Based on data for all years, including only cities with at least 500 fire incidents)
| Albany: | 5 minutes |
| Rensselaer: | 4 minutes |
| Delmar: | 6 minutes |
| Colonie: | 7 minutes |
| Wynantskill: | 8 minutes |
| Troy: | 7 minutes |
| Cohoes: | 4 minutes |
| West Sand Lake: | 7 minutes |
| Waterford: | 5 minutes |
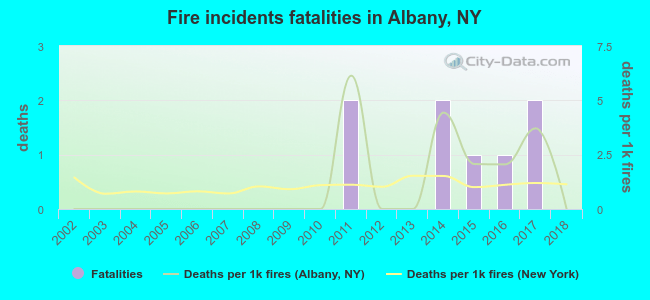 Based on the reports from the years 2002 - 2018 the average number of fire-related fatalities per year is 0. The highest number of deaths - 2 took place in 2011, and the lowest - 0 in 2002. The data has a constant trend.
The average number of fatalities per 1,000 fires is 1. This indicator was the highest - 6 in 2011, and the lowest 0 in 2002. The trend for deaths per 1,000 incidents is constant. Compared to the New York value the number of fatalities per 1,000 incidents is higher.
Based on the reports from the years 2002 - 2018 the average number of fire-related fatalities per year is 0. The highest number of deaths - 2 took place in 2011, and the lowest - 0 in 2002. The data has a constant trend.
The average number of fatalities per 1,000 fires is 1. This indicator was the highest - 6 in 2011, and the lowest 0 in 2002. The trend for deaths per 1,000 incidents is constant. Compared to the New York value the number of fatalities per 1,000 incidents is higher.Deaths per 1,000 incidents in Albany, NY compared to nearest cities:
(Note: Based on data for all years, including only cities with at least 2,500 fire incidents)
| Albany: | 1.6 |
| Schenectady: | 2.4 |
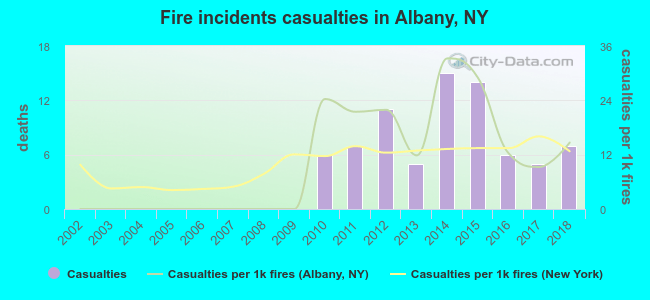 Based on the data from the years 2002 - 2018 the average number of fire-related casualties per year is 4. The highest number of reported casualties - 15 took place in 2014, and the lowest - 0 in 2002. The data has an increasing trend.
The average number of injuries per 1,000 fires is 10. This indicator was the highest - 33 in 2014, and the lowest 0 in 2002. The trend for injuries per 1,000 incidents is rising. Compared to the New York value the number of casualties per 1,000 fires is higher.
Based on the data from the years 2002 - 2018 the average number of fire-related casualties per year is 4. The highest number of reported casualties - 15 took place in 2014, and the lowest - 0 in 2002. The data has an increasing trend.
The average number of injuries per 1,000 fires is 10. This indicator was the highest - 33 in 2014, and the lowest 0 in 2002. The trend for injuries per 1,000 incidents is rising. Compared to the New York value the number of casualties per 1,000 fires is higher.Casualties per 1,000 incidents in Albany, NY compared to nearest cities:
(Note: Based on data for all years, including only cities with at least 500 fire incidents)
| Albany: | 15.6 |
| Rensselaer: | 7.9 |
| Delmar: | 12.5 |
| Colonie: | 2.6 |
| Wynantskill: | 5.4 |
| Troy: | 6.3 |
| Cohoes: | 13.3 |
| West Sand Lake: | 0.0 |
| Waterford: | 4.6 |
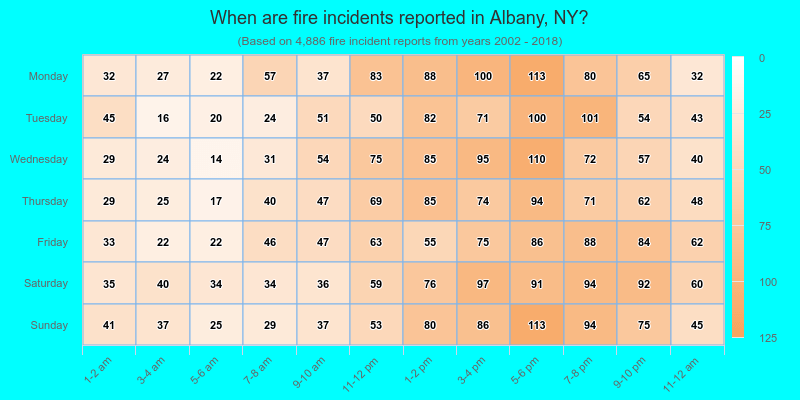
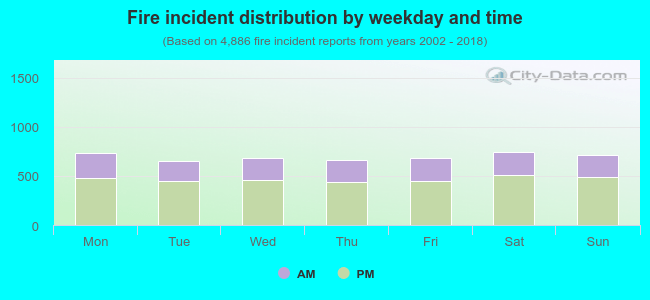 33.0% incidents where reported in the morning and 67.0% in the evening. The most fires (15.3%) took place on Saturday, and the least (13.4%) on Tuesday.
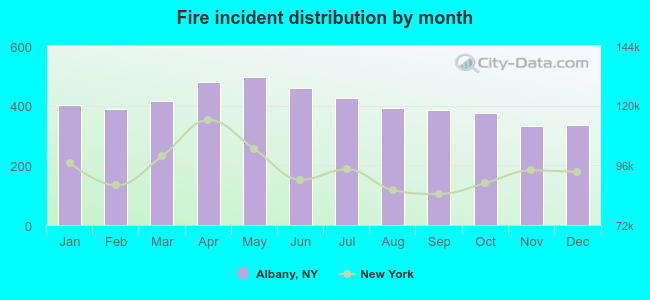 According to the 4,886 fire incident reports from years 2002 - 2018 most fires (10.1%) took place during May, and the least (6.8%) in November.
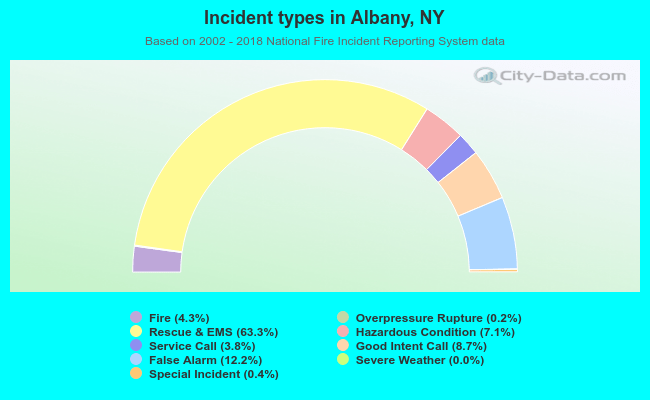 Out of all 113,309 cases reported during the years 2002 - 2018, the most belonged to the categories: Rescue & EMS (63.3%), False Alarm (12.2%), and Good Intent Call (8.7%).
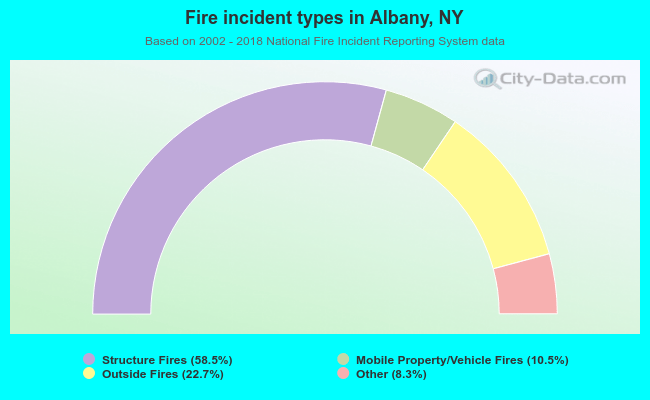 When looking into fire subcategories, the most incidents belonged to: Structure Fires (58.5%), and Outside Fires (22.7%).