Colonie: Fire Incidents, New York (NY)
Where are fire incidents reported in Colonie, NY
Something went wrong! Please refresh the page.
| Fire incidents reported | |
|---|---|
| Sreet name | Count |
| CENTRAL AVE | 590 |
| WOLF RD | 172 |
| SAND CREEK RD | 126 |
| RAILROAD AVE | 54 |
| CENTRAL AVE | 36 |
| ALBANY SHAKER RD | 32 |
| EXCHANGE ST | 26 |
| CALIFORNIA AVE | 22 |
| HACKETT AVE | 20 |
| OSBORNE RD | 18 |
| FULLER RD | 16 |
| LOUDON RD | 16 |
| WOLF ROAD | 16 |
| AHL AVE | 14 |
| JULES DR | 12 |
| MORDELLA RD | 12 |
| VLY RD | 12 |
| CENTRAL | 10 |
| COMPUTER DR | 10 |
| ELMHURST AVE | 10 |
| FREDERICK AVE | 10 |
| HUDSON AVE | 10 |
| TULL DR | 10 |
| VAN BUREN AVE | 10 |
| WINNERS CIR | 10 |
| ALBANY ST | 8 |
| EVERETT RD | 8 |
| KRAFT AVE | 8 |
| LEDGEWOOD DR | 8 |
| LINCOLN AVE | 8 |
2003 - 2018 National Fire Incident Reporting System (NFIRS) incidents
- Incident types reported to NFIRS in Colonie, NY
- 1,57927.0%Rescue & EMS
- 1,23721.2%False Alarm
- 1,16319.9%Fire
- 75412.9%Hazardous Condition
- 73112.5%Good Intent Call
- 3516.0%Service Call
- 160.3%Overpressure Rupture
- 70.1%Special Incident
- Fire incident types reported to NFIRS in Colonie, NY
- 54446.8%Structure Fires
- 39133.6%Outside Fires
- 13811.9%Mobile Property/Vehicle Fires
- 907.7%Other
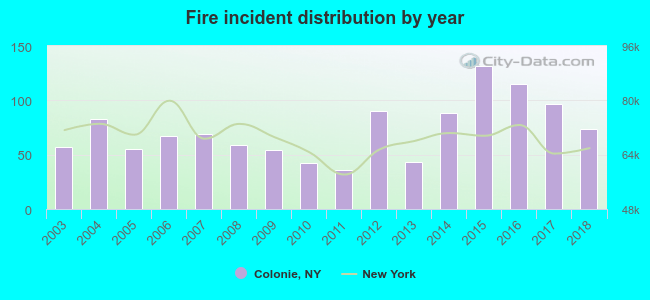 According to the data from the years 2003 - 2018 the average number of fires per year is 73. The highest number of fire incidents - 132 took place in 2015, and the least - 36 in 2011. The data has a rising trend.
The average number of yearly fire incidents per 10k residents in Colonie, NY compared to nearest cities:
(Note: Based on data for the last 3 years, including only cities with population 5,000 and above)
| Colonie: | 120.5 |
| Guilderland: | 7.3 |
| Albany: | 50.8 |
| Watervliet: | 23.5 |
| Delmar: | 28.2 |
| Rensselaer: | 136.6 |
| Schenectady: | 72.1 |
| Cohoes: | 42.8 |
| Rotterdam: | 1.0 |
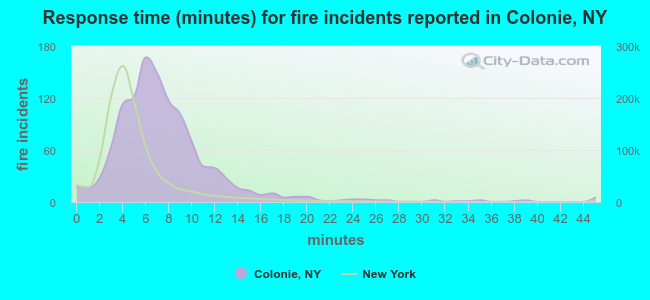 The median response time based on all reported fire incidents is 7 minutes. This is higher than the New York median value.
The median response time in Colonie, NY compared to nearest cities:
(Note: Based on data for all years, including only cities with at least 500 fire incidents)
| Colonie: | 7 minutes |
| Albany: | 5 minutes |
| Delmar: | 6 minutes |
| Rensselaer: | 4 minutes |
| Niskayuna: | 4 minutes |
| Schenectady: | 4 minutes |
| Cohoes: | 4 minutes |
| Troy: | 7 minutes |
| Waterford: | 5 minutes |
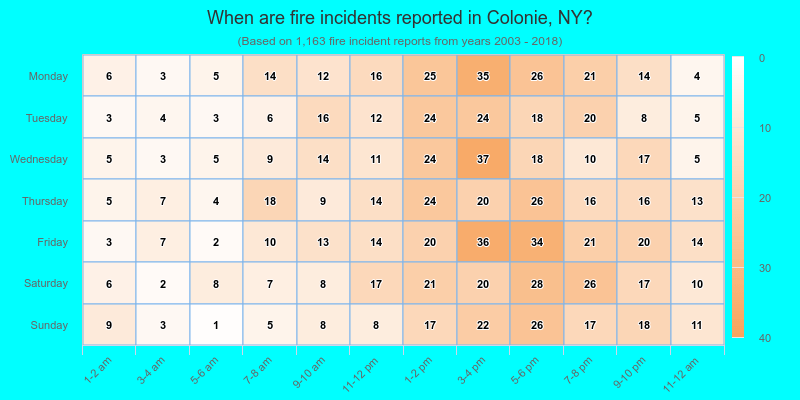
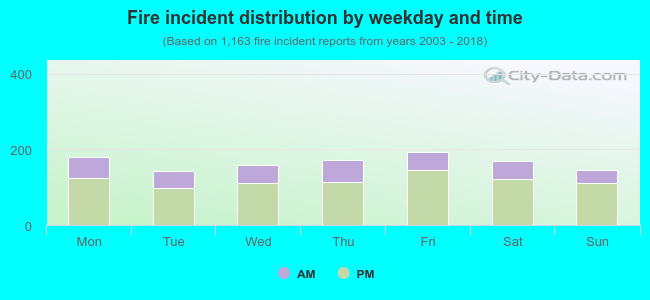 28.8% incidents where reported in the morning and 71.2% in the evening. The most fires (16.7%) took place on Friday, and the least (12.3%) on Tuesday.
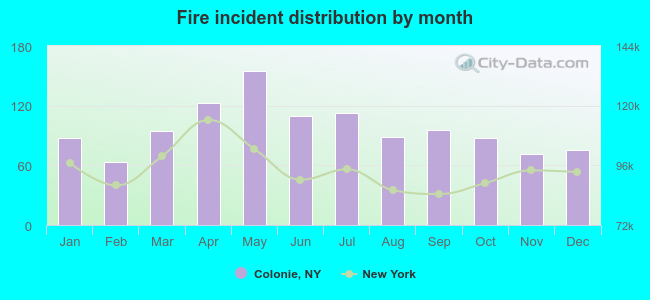 Based on the 1,163 fire incident reports from years 2003 - 2018 most fires (13.3%) took place during May, and the least (5.4%) in February.
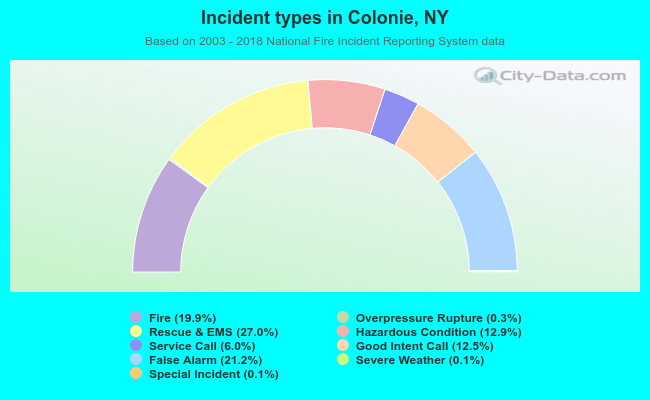 Out of all 5,843 cases reported during the years 2003 - 2018, the most belonged to the categories: Rescue & EMS (27.0%), False Alarm (21.2%), and Fire (19.9%).
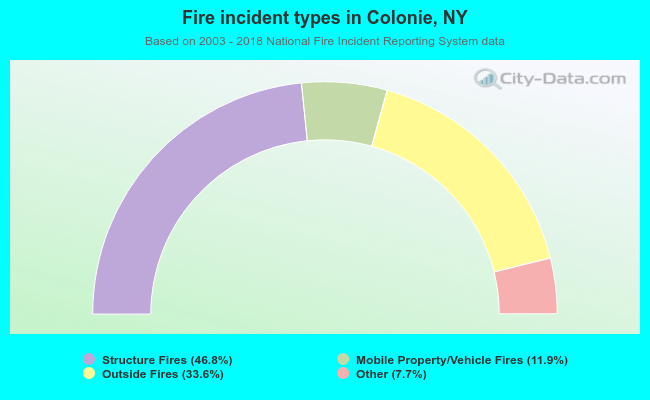 When looking into fire subcategories, the most reports belonged to: Structure Fires (46.8%), and Outside Fires (33.6%).