Columbia: Fire Incidents, Pennsylvania (PA)
Where are fire incidents reported in Columbia, PA
Something went wrong! Please refresh the page.
| Fire incidents reported | |
|---|---|
| Sreet name | Count |
| LOCUST ST | 286 |
| LANCASTER AVE | 268 |
| WALNUT ST | 254 |
| COLUMBIA AVE | 190 |
| 3RD ST | 182 |
| OAK HOLLOW DR | 132 |
| UNION ST | 128 |
| MARIETTA AVE | 106 |
| PLANE ST | 96 |
| MANOR ST | 92 |
| PROSPECT RD | 92 |
| 2ND ST | 90 |
| CHESTNUT ST | 88 |
| MILL ST | 88 |
| 4TH ST | 82 |
| 9TH ST | 82 |
| CHERRY ST | 82 |
| LOCUST ST | 82 |
| 5TH ST | 78 |
| FRONT ST | 78 |
| IRONVILLE PIKE | 76 |
| 8TH ST | 70 |
| PERRY ST | 70 |
| KLINESVILLE RD | 64 |
| RT 30 | 58 |
| KINDERHOOK RD | 54 |
| 30 RT | 50 |
| THIRD ST | 46 |
| LINDEN ST | 42 |
| CHICKIES HILL RD | 40 |
2002 - 2018 National Fire Incident Reporting System (NFIRS) incidents
- Incident types reported to NFIRS in Columbia, PA
- 2,81840.1%Fire
- 1,53221.8%Hazardous Condition
- 92413.1%Rescue & EMS
- 76110.8%False Alarm
- 4766.8%Good Intent Call
- 4576.5%Service Call
- 280.4%Special Incident
- 270.4%Severe Weather
- 120.2%Overpressure Rupture
- Fire incident types reported to NFIRS in Columbia, PA
- 1,93368.6%Structure Fires
- 45716.2%Outside Fires
- 30310.8%Mobile Property/Vehicle Fires
- 1254.4%Other
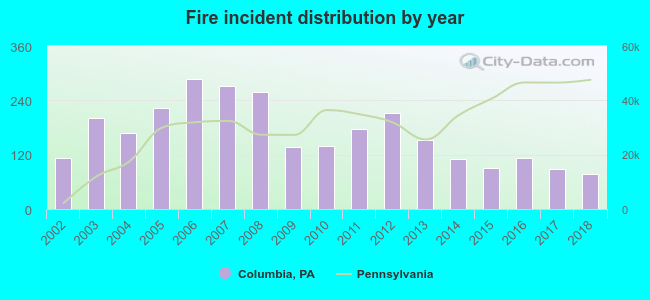 Based on the data from the years 2002 - 2018 the average number of fires per year is 166. The highest number of fire incidents - 288 took place in 2006, and the least - 78 in 2018. The data has a declining trend.
The average number of yearly fire incidents per 10k residents in Columbia, PA compared to nearest cities:
(Note: Based on data for the last 3 years, including only cities with population 5,000 and above)
| Columbia: | 89.6 |
| Mount Joy: | 82.4 |
| Millersville: | 27.5 |
| Elizabethtown: | 78.4 |
| Lancaster: | 100.2 |
| Red Lion: | 68.0 |
| Willow Street: | 31.7 |
| York: | 121.7 |
| Lititz: | 50.4 |
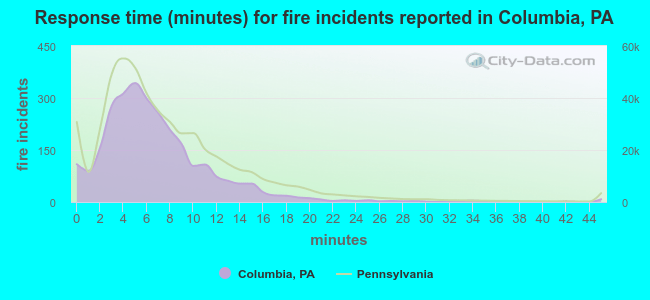 The median response time based on all reported fire incidents is 6 minutes. This is about the same as the Pennsylvania median value.
The median response time in Columbia, PA compared to nearest cities:
(Note: Based on data for all years, including only cities with at least 500 fire incidents)
| Columbia: | 6 minutes |
| Wrightsville: | 9 minutes |
| Marietta: | 8 minutes |
| Mount Joy: | 8 minutes |
| Landisville: | 9 minutes |
| Millersville: | 8 minutes |
| Elizabethtown: | 9 minutes |
| Lancaster: | 7 minutes |
| Manheim: | 10 minutes |
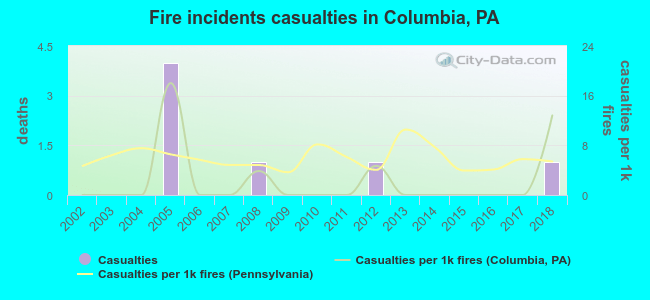 According to the reports from the years 2002 - 2018 the average number of fire-related yearly casualties is 0. The highest number of reported injuries - 4 took place in 2005, and the lowest - 0 in 2002. The data has an increasing trend.
The average number of injuries per 1,000 fires is 2. This indicator was the highest - 18 in 2005, and the lowest 0 in 2002. The trend for injuries per 1,000 fires is growing. Compared to the state value the number of injuries per 1,000 fires is much lower.
According to the reports from the years 2002 - 2018 the average number of fire-related yearly casualties is 0. The highest number of reported injuries - 4 took place in 2005, and the lowest - 0 in 2002. The data has an increasing trend.
The average number of injuries per 1,000 fires is 2. This indicator was the highest - 18 in 2005, and the lowest 0 in 2002. The trend for injuries per 1,000 fires is growing. Compared to the state value the number of injuries per 1,000 fires is much lower.Casualties per 1,000 incidents in Columbia, PA compared to nearest cities:
(Note: Based on data for all years, including only cities with at least 500 fire incidents)
| Columbia: | 2.5 |
| Wrightsville: | 0.0 |
| Marietta: | 0.0 |
| Mount Joy: | 5.4 |
| Landisville: | 0.0 |
| Millersville: | 2.0 |
| Elizabethtown: | 3.1 |
| Lancaster: | 5.3 |
| Manheim: | 3.5 |
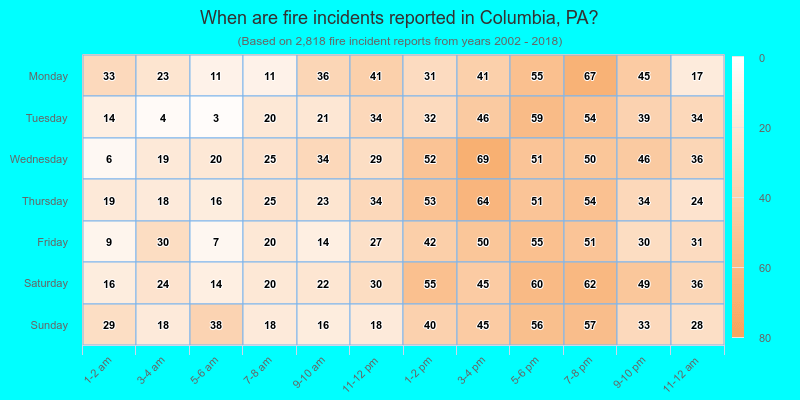
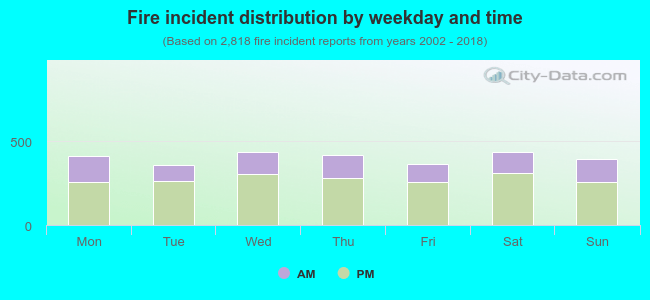 31.5% incidents where reported in the morning and 68.5% in the evening. The most fires (15.5%) took place on Wednesday, and the least (12.8%) on Tuesday.
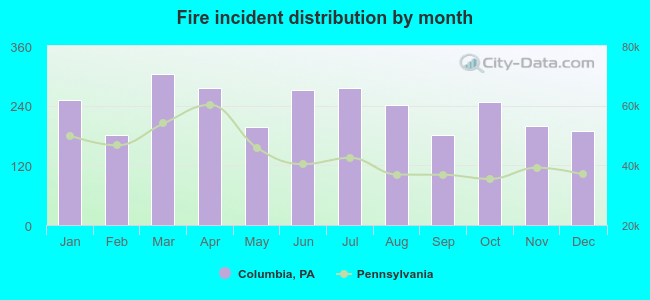 According to the 2,818 incident reports from years 2002 - 2018 most fires (10.8%) took place during March, and the least (6.4%) in February.
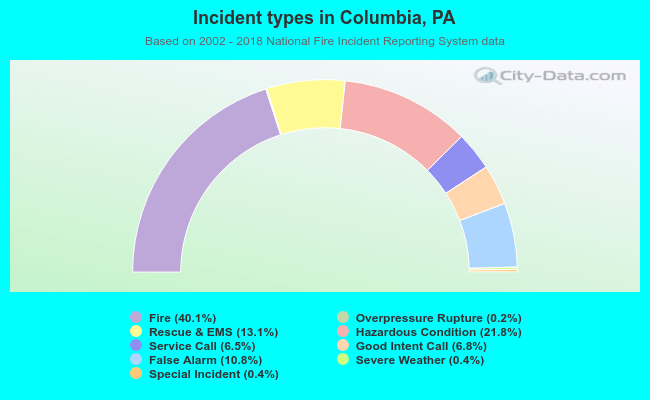 Out of all 7,035 cases reported during the years 2002 - 2018, the most belonged to the categories: Fire (40.1%), Hazardous Condition (21.8%), and Rescue & EMS (13.1%).
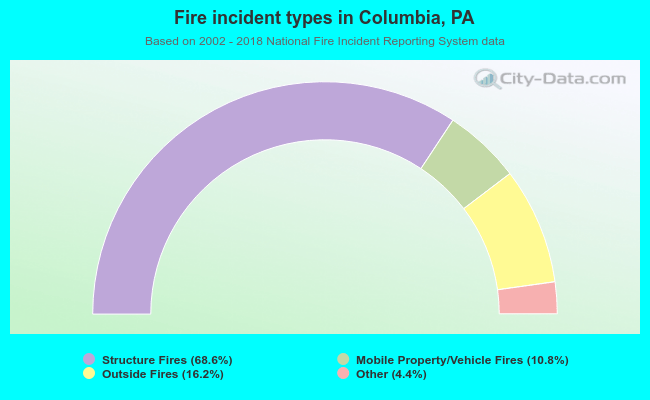 When looking into fire subcategories, the most reports belonged to: Structure Fires (68.6%), and Outside Fires (16.2%).