Elizabethtown: Fire Incidents, Pennsylvania (PA)
Where are fire incidents reported in Elizabethtown, PA
Something went wrong! Please refresh the page.
| Fire incidents reported | |
|---|---|
| Sreet name | Count |
| MARKET ST | 248 |
| HIGH ST | 122 |
| TURNPIKE RD | 96 |
| RIDGE RD | 84 |
| BOSSLER RD | 68 |
| POPLAR ST | 66 |
| HANOVER ST | 58 |
| BAINBRIDGE RD | 56 |
| CLOVERLEAF RD | 52 |
| ELIZABETHTOWN RD | 50 |
| COLEBROOK RD | 48 |
| MOUNT GRETNA RD | 46 |
| OLD HERSHEY RD | 46 |
| 283 RT | 40 |
| CAMPUS RD | 40 |
| PARK ST | 40 |
| HERSHEY RD | 38 |
| WILLOW ST | 36 |
| SPRUCE ST | 34 |
| MAYTOWN RD | 32 |
| WASHINGTON ST | 32 |
| HEISEY QUARRY RD | 30 |
| MOUNT JOY ST | 28 |
| MILL RD | 26 |
| ROUTE 283 | 26 |
| HUMMELSTOWN ST | 24 |
| MILTON GROVE RD | 24 |
| RIDGEVIEW RD | 24 |
| GROFF AVE | 22 |
| MASONIC DR | 22 |
| Other | 63 |
2003 - 2018 National Fire Incident Reporting System (NFIRS) incidents
- Incident types reported to NFIRS in Elizabethtown, PA
- 1,62129.6%Fire
- 1,43526.2%Hazardous Condition
- 82315.0%Good Intent Call
- 61811.3%Service Call
- 58610.7%Rescue & EMS
- 3616.6%False Alarm
- 200.4%Special Incident
- 60.1%Overpressure Rupture
- Fire incident types reported to NFIRS in Elizabethtown, PA
- 1,17572.5%Structure Fires
- 26116.1%Outside Fires
- 17310.7%Mobile Property/Vehicle Fires
- 120.7%Other
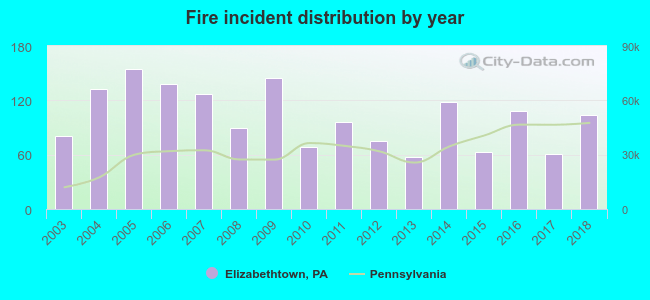 According to the data from the years 2003 - 2018 the average number of fire incidents per year is 101. The highest number of fires - 155 took place in 2005, and the least - 57 in 2013. The data has a rising trend.
The average number of yearly fire incidents per 10k residents in Elizabethtown, PA compared to nearest cities:
(Note: Based on data for the last 3 years, including only cities with population 5,000 and above)
| Elizabethtown: | 78.4 |
| Mount Joy: | 82.4 |
| Middletown: | 69.5 |
| Hershey: | 37.4 |
| Columbia: | 89.6 |
| Palmyra: | 69.9 |
| Steelton: | 64.1 |
| York: | 121.7 |
| New Cumberland: | 60.1 |
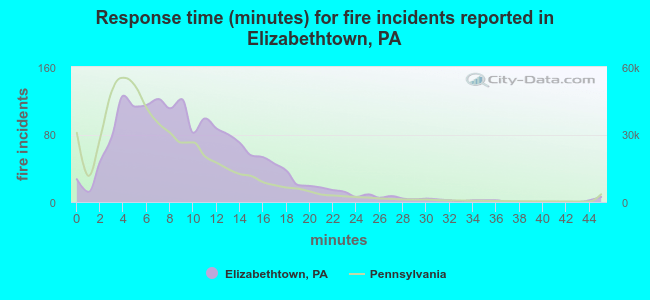 The median response time based on all reported fire incidents is 9 minutes. This is higher compared to the Pennsylvania median value.
The median response time in Elizabethtown, PA compared to nearest cities:
(Note: Based on data for all years, including only cities with at least 500 fire incidents)
| Elizabethtown: | 9 minutes |
| Mount Joy: | 8 minutes |
| Marietta: | 8 minutes |
| Middletown: | 9 minutes |
| Manchester: | 8 minutes |
| Hershey: | 8 minutes |
| Wrightsville: | 9 minutes |
| Hummelstown: | 10 minutes |
| Columbia: | 6 minutes |
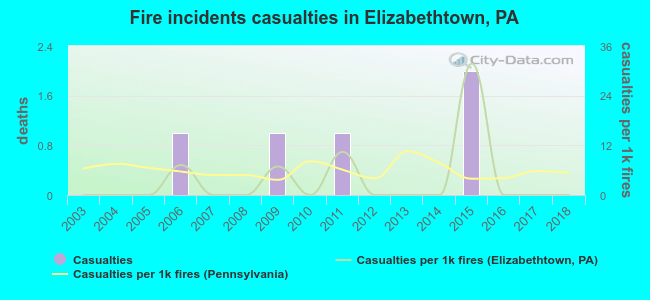 According to the data from the years 2003 - 2018 the average number of fire-related yearly casualties is 0. The highest number of casualties - 2 took place in 2015, and the lowest - 0 in 2003. The data has a constant trend.
The average number of injuries per 1,000 fires is 4. This indicator was the highest - 32 in 2015, and the lowest 0 in 2003. The trend for injuries per 1,000 fire incidents is constant. Compared to the Pennsylvania value the number of casualties per 1,000 incidents is lower.
According to the data from the years 2003 - 2018 the average number of fire-related yearly casualties is 0. The highest number of casualties - 2 took place in 2015, and the lowest - 0 in 2003. The data has a constant trend.
The average number of injuries per 1,000 fires is 4. This indicator was the highest - 32 in 2015, and the lowest 0 in 2003. The trend for injuries per 1,000 fire incidents is constant. Compared to the Pennsylvania value the number of casualties per 1,000 incidents is lower.Casualties per 1,000 incidents in Elizabethtown, PA compared to nearest cities:
(Note: Based on data for all years, including only cities with at least 500 fire incidents)
| Elizabethtown: | 3.1 |
| Mount Joy: | 5.4 |
| Marietta: | 0.0 |
| Middletown: | 0.0 |
| Manchester: | 3.8 |
| Hershey: | 14.8 |
| Wrightsville: | 0.0 |
| Hummelstown: | 7.1 |
| Columbia: | 2.5 |
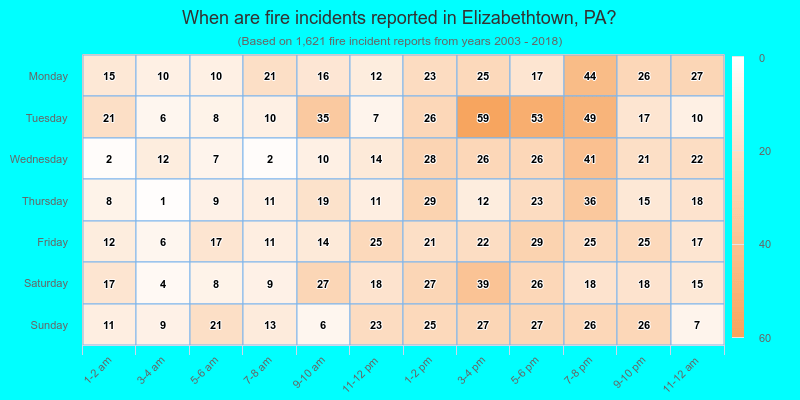
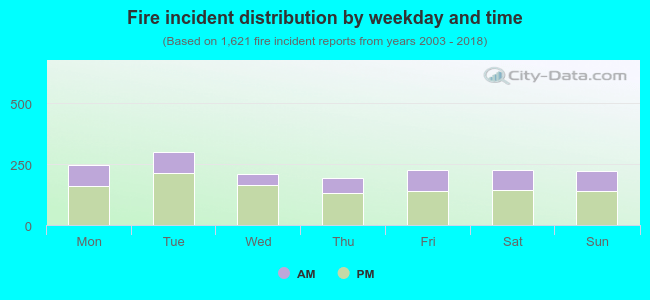 32.6% incidents where reported in the morning and 67.4% in the evening. The most fires (18.6%) took place on Tuesday, and the least (11.8%) on Thursday.
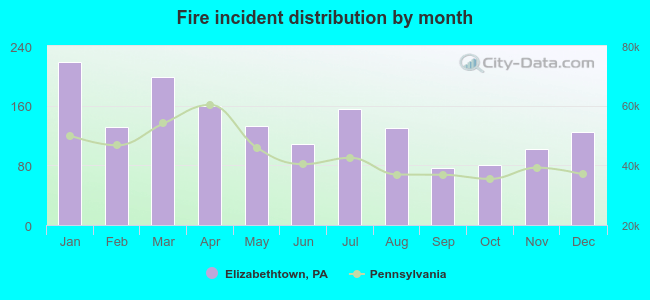 Based on the 1,621 fire incident reports from years 2003 - 2018 most fires (13.5%) took place during January, and the least (4.8%) in September.
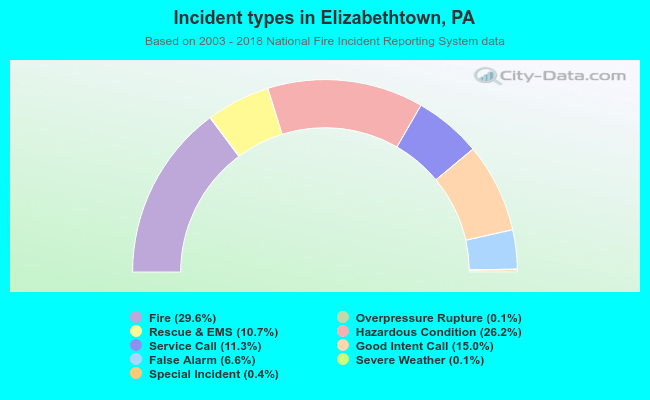 Out of all 5,474 cases reported during the years 2003 - 2018, the most belonged to the categories: Fire (29.6%), Hazardous Condition (26.2%), and Good Intent Call (15.0%).
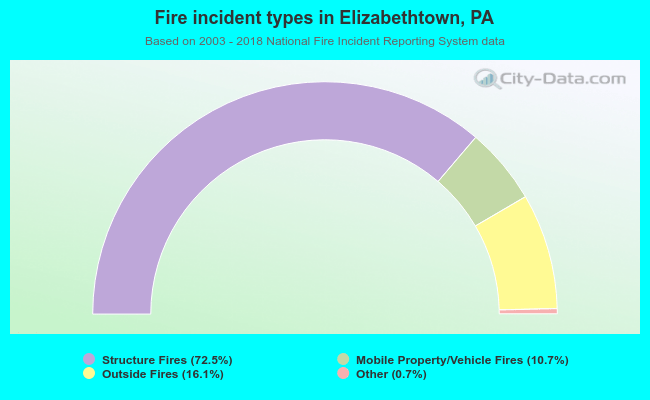 When looking into fire subcategories, the most reports belonged to: Structure Fires (72.5%), and Outside Fires (16.1%).