Congers: Fire Incidents, New York (NY)
Where are fire incidents reported in Congers, NY
Something went wrong! Please refresh the page.
|
| |||||||||||||||||||||||||||||||||||||||||||||||||||||||||||||||||||||||||||||||||||||||||||||||||||||||||||||
2002 - 2018 National Fire Incident Reporting System (NFIRS) incidents
- Incident types reported to NFIRS in Congers, NY
- 52328.4%False Alarm
- 49326.8%Hazardous Condition
- 43523.6%Fire
- 19710.7%Good Intent Call
- 1447.8%Service Call
- 402.2%Rescue & EMS
- 80.4%Severe Weather
- Fire incident types reported to NFIRS in Congers, NY
- 23253.3%Structure Fires
- 13531.0%Outside Fires
- 5713.1%Mobile Property/Vehicle Fires
- 112.5%Other
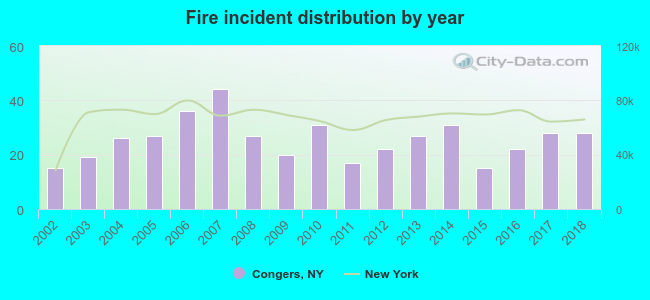 According to the data from the years 2002 - 2018 the average number of fires per year is 26. The highest number of fire incidents - 44 took place in 2007, and the least - 15 in 2002. The data has a rising trend.
The average number of yearly fire incidents per 10k residents in Congers, NY compared to nearest cities:
(Note: Based on data for the last 3 years, including only cities with population 5,000 and above)
| Congers: | 31.1 |
| Valley Cottage: | 30.4 |
| New City: | 19.5 |
| Haverstraw: | 40.0 |
| Nyack: | 3.8 |
| New Square: | 16.5 |
| West Haverstraw: | 7.4 |
| Ossining: | 12.8 |
| Hillcrest: | 7.5 |
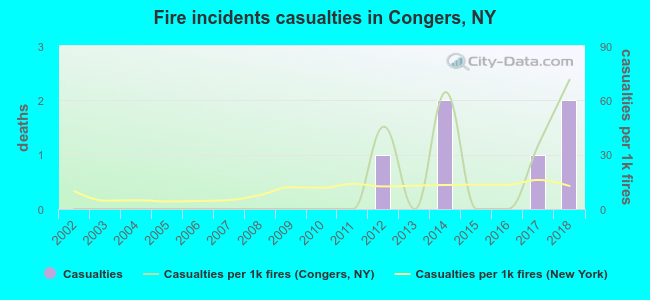 According to the reports from the years 2002 - 2018 the average number of fire-related casualties per year is 0. The highest number of reported casualties - 2 took place in 2014, and the lowest - 0 in 2002. The data has a rising trend.
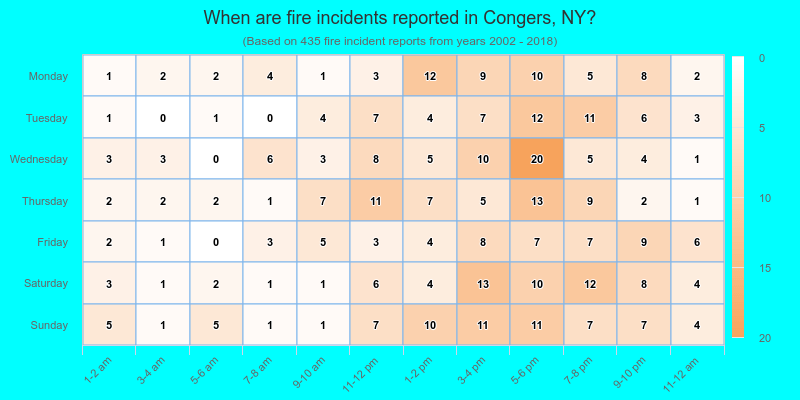
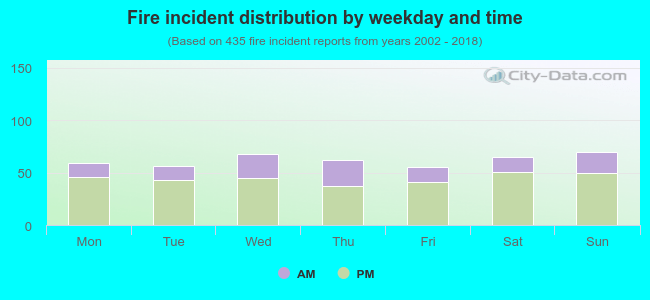 28.0% incidents where reported in the morning and 72.0% in the evening. The most fires (16.1%) took place on Sunday, and the least (12.6%) on Friday.
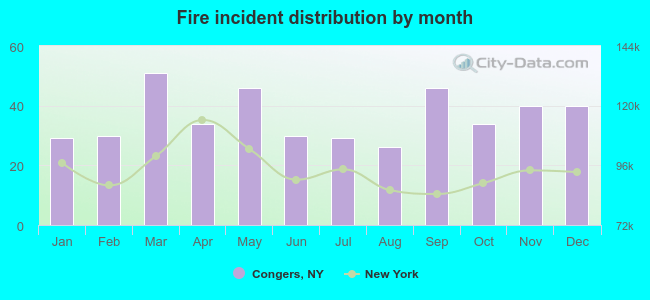 According to the 435 fire incidents from years 2002 - 2018 most fires (11.7%) took place during March, and the least (6.0%) in August.
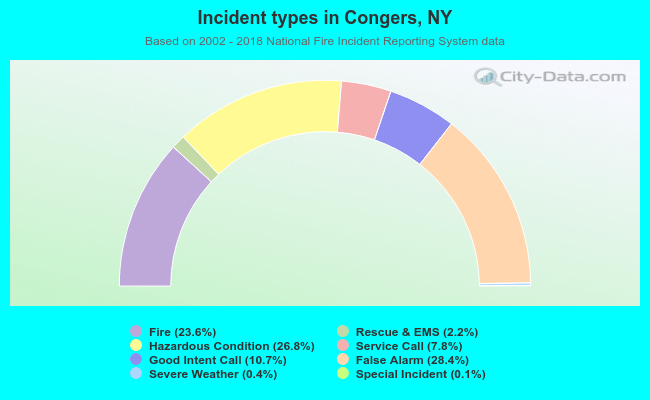 Out of all 1,841 cases reported during the years 2002 - 2018, the most belonged to the categories: Good Intent Call (28.4%), Rescue & EMS (26.8%), and Fire (23.6%).
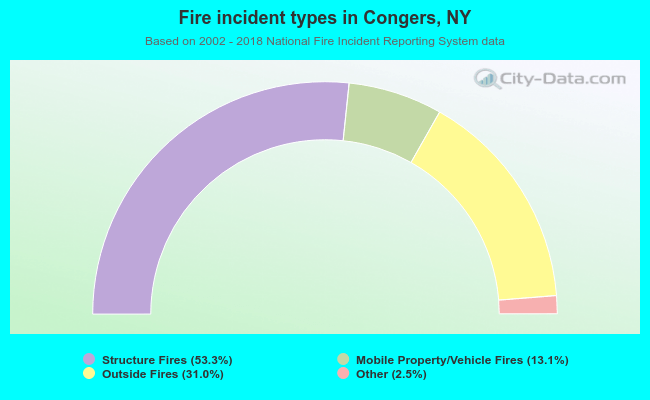 When looking into fire subcategories, the most incidents belonged to: Structure Fires (53.3%), and Outside Fires (31.0%).